Close Menu
  • Crypto News
  • Markets
  • Bitcoin
  • Ethereum
  • XRP
  • Altcoins
  • Technology
  • More
    • Crypto Prices – Latest from BTC, ETH & XRP
    • NFT
    • DeFi

Subscribe to Updates

Get the latest crypto news and updates directly to your inbox.

Trending

Andrew Tate’s crypto crashes amid UK legal action

June 7, 2025

Donald Trump Earns $1.2B From Crypto

June 7, 2025

Coinbase, BiT Global End Legal Fight Over WBTC Delisting

June 7, 2025

Week in Review: Why Anthropic cut access to Windsurf

June 7, 2025

Solana Key Indicator Flashes Buy Signal On Daily Chart – Rally Ahead?

June 7, 2025
Facebook X (Twitter) Instagram
  • Advertise
en English
nl Nederlandsen Englishfr Françaisde Deutschit Italianoru Русскийes Españolzh-CN 简体中文hi हिन्दीja 日本語
Crypto Observer
  • Crypto News

    Solana Key Indicator Flashes Buy Signal On Daily Chart – Rally Ahead?

    June 7, 2025

    Bitcoin Golden Cross Pattern Says The Crash To $100,000 Is Normal – What To Expect Next

    June 7, 2025

    $31M Bitcoin Donation to Ross Ulbricht Traced to AlphaBay, Not Silk Road

    June 7, 2025

    Elon Musk ‘Will Do Anything’ To Make XRP King, Tech Mogul Says

    June 7, 2025

    Ethereum Holds Key Range Support After Pullback – Bulls Eye $3,000 Level

    June 7, 2025
  • Markets
  • Bitcoin
  • Ethereum
  • XRP
  • Altcoins
  • Technology
  • More
    • Crypto Prices – Latest from BTC, ETH & XRP
    • NFT
    • DeFi
Facebook X (Twitter) Instagram
Crypto Observer
Home » Ethereum » Ethereum Rainbow Chart predicts ETH price for June 30, 2025
Ethereum

Ethereum Rainbow Chart predicts ETH price for June 30, 2025

Crypto Observer StaffBy Crypto Observer StaffJune 6, 2025No Comments2 Mins Read
Facebook Twitter Pinterest Reddit Telegram Email LinkedIn Tumblr
Share
Facebook Twitter LinkedIn Pinterest Email

Ethereum (ETH) is currently hovering around the $2,480 mark, and the Rainbow Chart projects the price might drop to a triple-digit or rise to a five-digit range by the end of the month.

The chart tracks Ethereum’s historical price performance using a logarithmic regression curve and projects future prices with a color-coded scale divided into nine zones. Each zone represents a different level of market sentiment, from significant undervaluation to intense overvaluation.

For June 30, Rainbow Chart projects a price range from $862 to $20,117.

The lowest color band, labeled “Fire Sale,” predicts a price between $862.75 and $1,169. This range signals deep undervaluation and rare buying opportunities. Above it lies the “BUY!” band, which ranges from $1,169.49 to $1,617.27, which is likewise seen as an attractive entry point.

Next up, the “Accumulate” level stretches from $1,617 to $2,274, suggesting a moderately bullish outlook. Above it, the “Still Cheap” zone covers the range from $2,274 to $3,239, where Ethereum would be considered below fair value but rising in appeal. At its current price, ETH is currently in this zone.

The “HODL!” band, which spans from $3,239 to $4,668. This band reflects neutral-to-positive sentiment. Above it is the so-called “Is this a bubble?” zone, ranging from $4,668.12 to $6,780.45, where price momentum begins to spark market caution.

Higher up, the “FOMO Intensifies” range goes from $6,780.45 to $9,865.96 and signals growing speculative fervor. If the price goes up even more, it will hit the “Sell. Seriously, SELL!” zone ranging from $9,865 to $14,109 and suggesting peak market heat.

The uppermost zone, the “Maximum Bubble Territory” band, ranges from $14,109 to $20,116.86 and suggests extreme overvaluation.

Ethereum price analysis

At press time, Ethereum is trading at $2,478, a -5.88% dip in the past 24 hours.
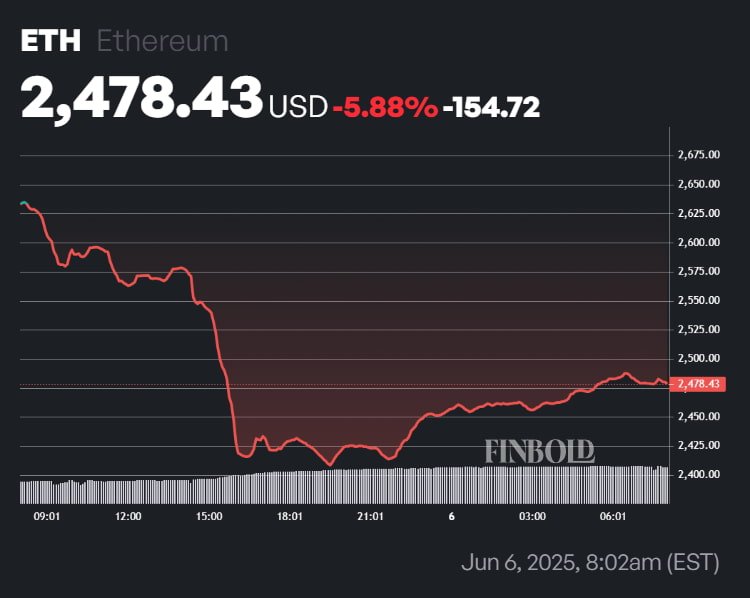
This places it somewhere in the middle of the “Still Cheap” zone, implying it is trading below fair value and likely to rise in appeal soon.

Indeed, upcoming upgrades like Fusaka and Glamsterdam could boost Ethereum’s throughput and bullish long-term prospects. However, rising leverage could also increase volatility risk.

Further bearish signals include a Moving Average Convergence/Divergence (MACD) histogram of -40 and a Relative Strength Index (RSI) of 46.72, which suggest consolidation.

Featured image via Shutterstock

Read the full article here

Share. Facebook Twitter Pinterest LinkedIn Tumblr Email

Related Posts

How Ethereum Is Faring Since Its Major Pectra Upgrade

June 7, 2025

Can Ethereum’s Smart Contract Sustain Amidst the Increasing Competition From Rivals?

June 7, 2025

$3000 in June – New All-Time High?

June 7, 2025

Could BlackRock’s $34.7M Ethereum Buy Signal a Bullish Shift for ETH Price?

June 6, 2025
Add A Comment

Leave A Reply Cancel Reply

Subscribe to Updates

Get the latest crypto news and updates directly to your inbox.

Top Posts

Andrew Tate’s crypto crashes amid UK legal action

June 7, 2025

Donald Trump Earns $1.2B From Crypto

June 7, 2025

Coinbase, BiT Global End Legal Fight Over WBTC Delisting

June 7, 2025
Advertisement
Demo

Crypto Observer is your one-stop website for the latest crypto news and updates, follow us now to get the news that matters to you.

Facebook X (Twitter) Instagram
Crypto News

Bitcoin Golden Cross Pattern Says The Crash To $100,000 Is Normal – What To Expect Next

June 7, 2025

$31M Bitcoin Donation to Ross Ulbricht Traced to AlphaBay, Not Silk Road

June 7, 2025

Elon Musk ‘Will Do Anything’ To Make XRP King, Tech Mogul Says

June 7, 2025
Get Informed

Subscribe to Updates

Get the latest crypto news and updates directly to your inbox.

Facebook X (Twitter)
  • Privacy Policy
  • Terms of use
  • Advertise with us | Publishing
  • Contact us
  • Crypto News – Press release
  • Newsletter sign up
  • Markets
  • Altcoins
  • Bitcoin
  • Crypto News
  • DeFi
  • Ethereum
  • Technology
  • Blockchain
  • AI
  • NFT
  • Thanks for joining us
© 2025 Crypto Observer. All Rights Reserved.

Type above and press Enter to search. Press Esc to cancel.