


 Holds Tight Range As Whales Ease Exposure")
Bitcoin (BTC) has been trading in a tight range between $83,000 and $86,000 over the past five days, showing signs of indecision in both price action and momentum indicators.
While the number of whale wallets has started to decline, on-chain data still reflects elevated interest from large holders. Technically, BTC remains in a consolidation phase, with weak EMA signals and mixed Ichimoku readings.
Bitcoin Whales Pull Back: Early Sign of Fading Confidence?
The number of Bitcoin whales—wallets holding between 1,000 and 10,000 BTC—has declined slightly in recent days, dropping from 2,015 on April 14 to 2,010 by April 16.
This pullback comes just after the metric hit its highest level since May 2024, suggesting a potential shift in sentiment among large holders.
While the drop may seem small, movements in whale behavior often precede broader market trends, making even slight changes worth watching.
Bitcoin Whales. Source: Santiment.
Whale activity is a key on-chain signal because these large holders can significantly influence market liquidity and price direction.
An increase in whale wallets often reflects accumulation and long-term confidence, while a decline may suggest strategic profit-taking or risk-off behavior.
The recent dip from the local peak could indicate that some whales are trimming exposure as market uncertainty rises. If the number continues to fall, it may signal weakening institutional conviction, potentially putting short-term pressure on Bitcoin’s price.
Bitcoin Stalls Near Ichimoku Pivot as Momentum Fades
The Ichimoku Cloud chart for Bitcoin shows a period of consolidation, with the price currently trading near the flat Tenkan-sen (blue line) and Kijun-sen (red line).
This alignment suggests a lack of short-term momentum, as both lines are moving sideways, indicating equilibrium between buyers and sellers.
The Kumo (cloud) ahead is bullish, with the Senkou Span A (green cloud boundary) above the Senkou Span B (red cloud boundary), but the distance between them is relatively narrow.
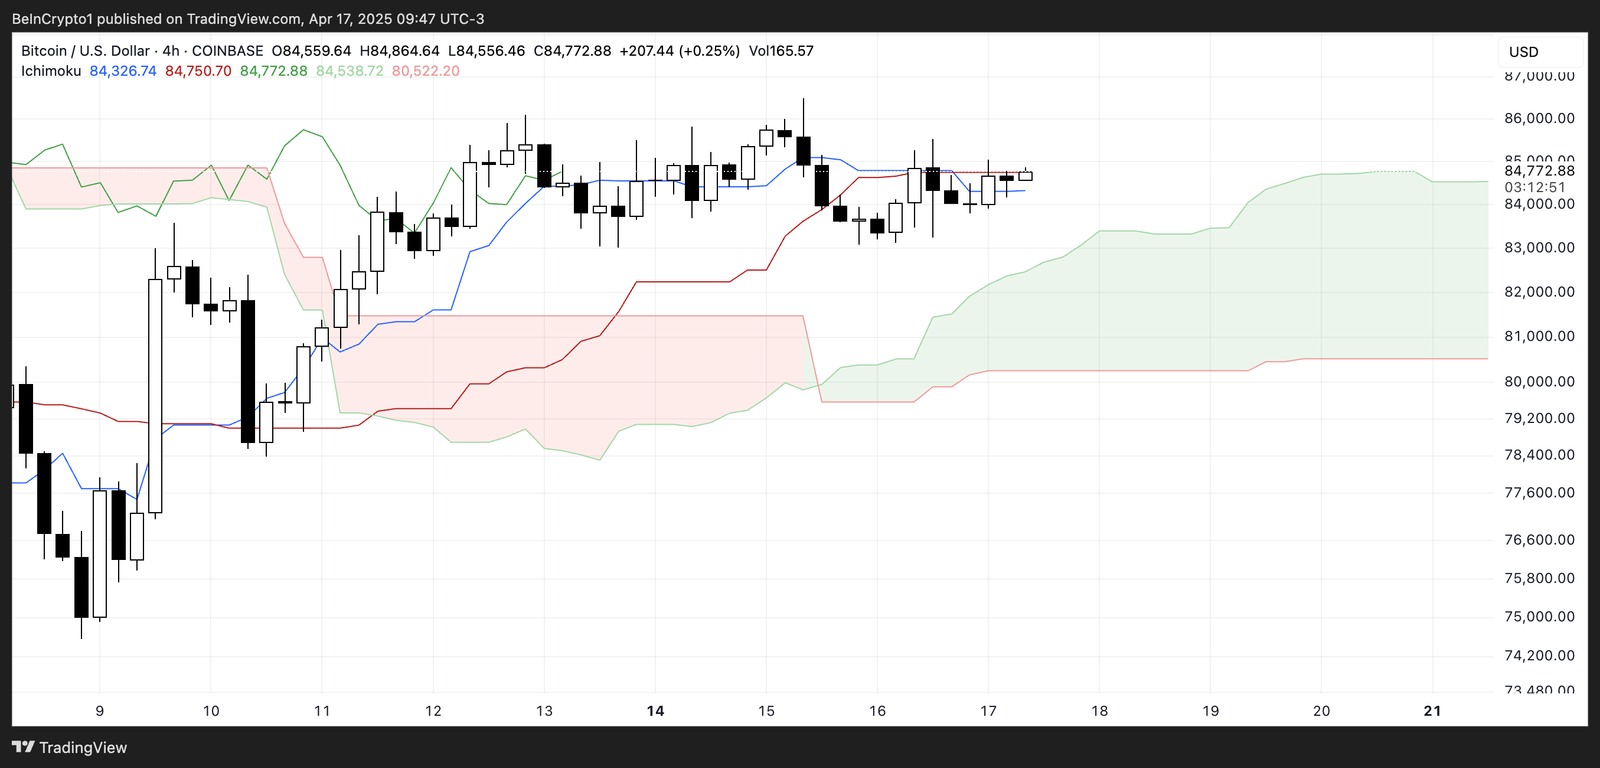
BTC Ichimoku Cloud. Source: TradingView.
This hints at weak bullish momentum for now. The price is sitting just above the cloud, which is a positive sign, but without a clear breakout above the Tenkan-sen and recent highs, the trend remains indecisive.
Chikou Span (lagging line) is overlapping with recent candles, reinforcing the sideways movement.
Overall, Bitcoin is hovering in a neutral-to-slightly-bullish zone, but it needs a stronger push to confirm a clear trend direction.
Bitcoin Struggles for Direction as Key Levels Loom
Bitcoin’s EMA lines are currently flat, indicating a weak and uncertain trend. The price action shows hesitation, with bulls and bears lacking conviction.
If the support level at $83,583 is tested and fails to hold, the market could enter a sharper correction, targeting the next support at $81,177.
A break below that could push Bitcoin price under the psychological $80,000 level once again, with $79,890 as the next possible downside target.
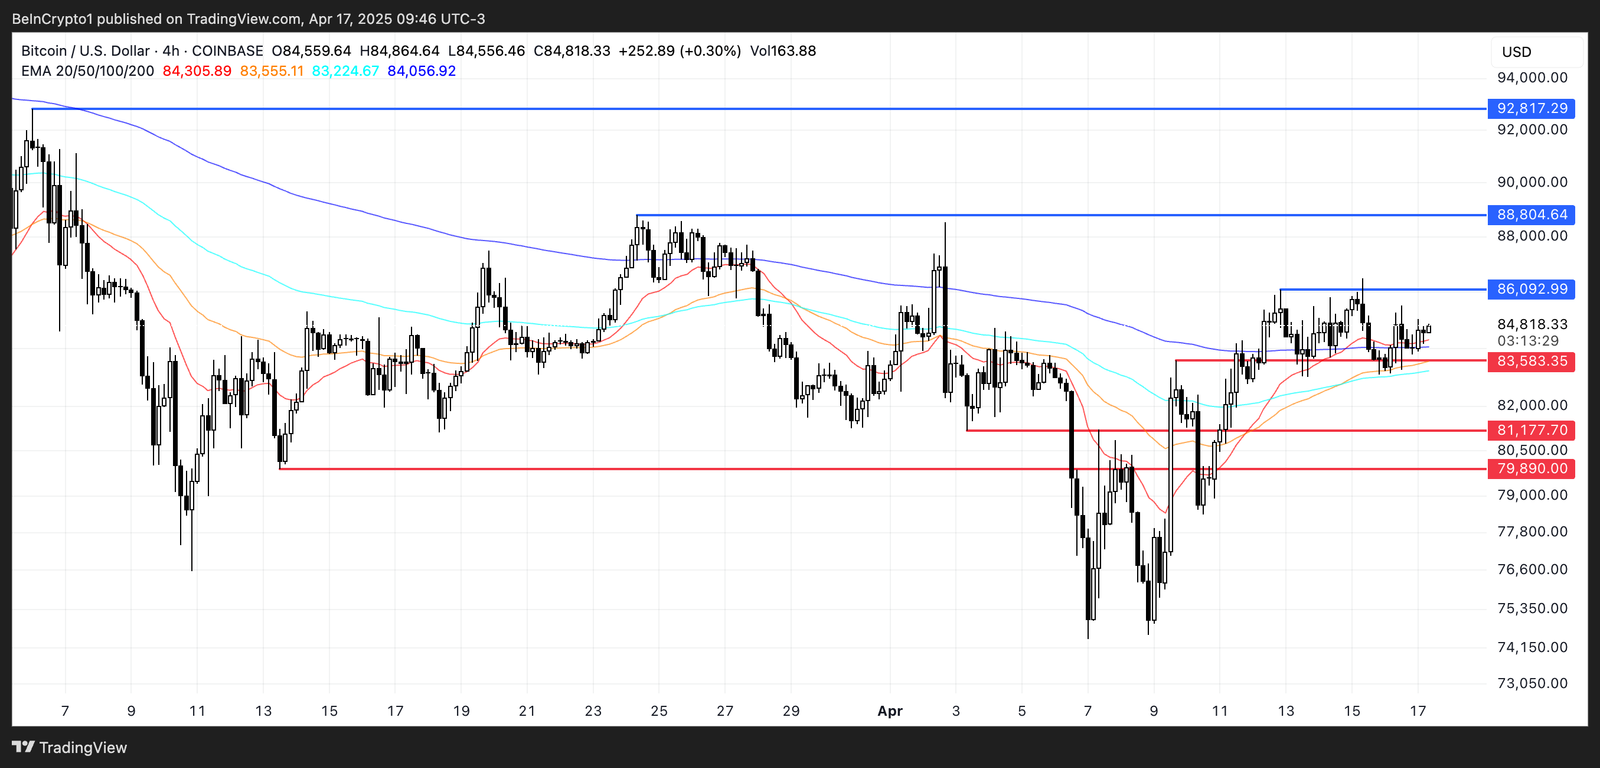
BTC Price Analysis. Source: TradingView.
However, if bulls manage to regain control, Bitcoin could shift toward recovery. The first key resistance lies at $86,092—breaking this level would suggest renewed upward momentum.
From there, the next upside targets would be $88,804 and, if the trend strengthens further, $92,817.
Reaching this level would mean breaking above the $90,000 mark for the first time since March 7, potentially sparking renewed interest from both retail and institutional investors.
Read the full article here


 Could Be Approaching Early Bear Market Phase: Glassnode")