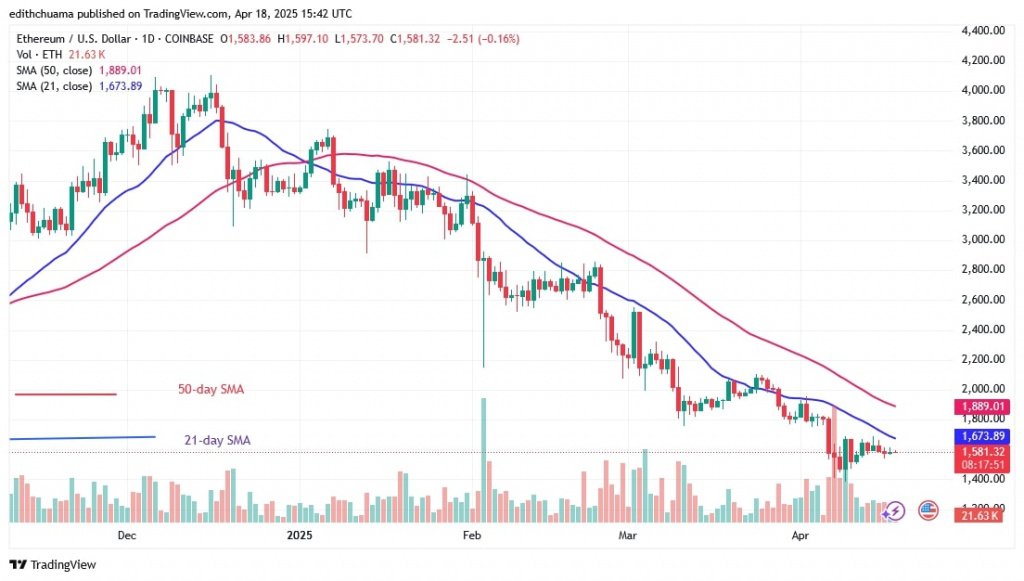
The Ethereum price has stabilized above the support at $1,400 and below the resistance at $1,700 or the moving average lines.
Ethereum price long-term analysis: bearish
The price movement has stagnated above $1,500 since April 11, as Coinidol.com wrote before. The presence of doji candlesticks indicates that traders are uncertain about the direction the market will take. The 21-day SMA barrier and support at $1,400 have limited the cryptocurrency’s upside and downside moves.
On the upside, Ether will regain its positive momentum if it rallies and breaks above the 21-day SMA barrier, the bullish momentum will extend to the high of $1,750. The largest altcoin will resume its positive trend if buyers sustain the price above the $1,750 high. Ether is currently trading above the $1,500 support level, making the direction unclear. At the time of writing, Ether is $1,602.
ETH indicator analysis
The decline has stopped above the $1,500 support, but Ether price bars are below the moving average lines. Doji candlesticks have dominated price activity. The 21-day SMA has opposed the cryptocurrency’s uptrend on the daily chart. Ether will resume its uptrend once the price bars are above the 21- and 50-day SMAs.
Technical Indicators:
Key Resistance Levels – $4,000 and $4,500
Key Support Levels – $2.000 and $1,500
What is the next direction for Ethereum?
The price of Ethereum is stabilizing above the $1,500 support. The price action above the existing support has been halted by buyers and sellers. The largest altcoin will rise as buyers emerge in the oversold region of the market.
However, it is doubtful that the cryptocurrency will fall further.

Disclaimer. This analysis and forecast are the personal opinions of the author. They are not a recommendation to buy or sell cryptocurrency and should not be viewed as an endorsement by CoinIdol.com. Readers should do their research before investing in funds.
Read the full article here
