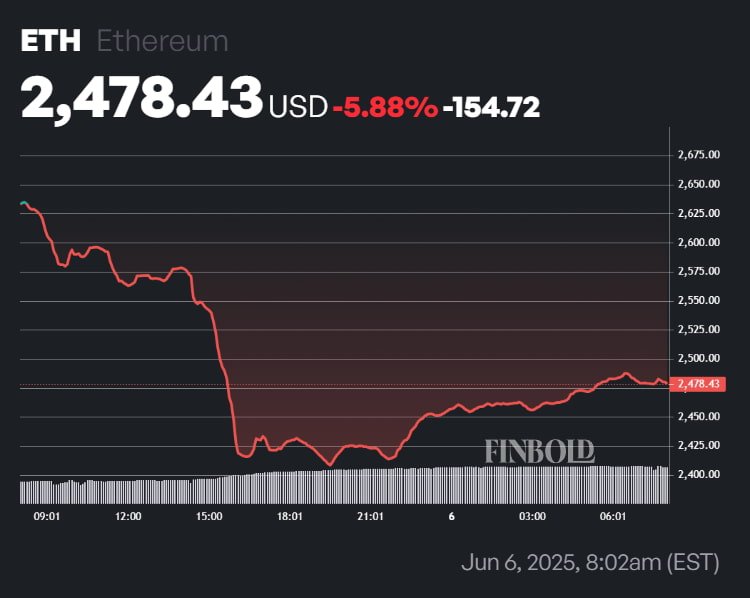
Ethereum (ETH) is currently hovering around the $2,480 mark, and the Rainbow Chart projects the price might drop to a triple-digit or rise to a five-digit range by the end of the month.
The chart tracks Ethereum’s historical price performance using a logarithmic regression curve and projects future prices with a color-coded scale divided into nine zones. Each zone represents a different level of market sentiment, from significant undervaluation to intense overvaluation.
For June 30, Rainbow Chart projects a price range from $862 to $20,117.
The lowest color band, labeled “Fire Sale,” predicts a price between $862.75 and $1,169. This range signals deep undervaluation and rare buying opportunities. Above it lies the “BUY!” band, which ranges from $1,169.49 to $1,617.27, which is likewise seen as an attractive entry point.
Next up, the “Accumulate” level stretches from $1,617 to $2,274, suggesting a moderately bullish outlook. Above it, the “Still Cheap” zone covers the range from $2,274 to $3,239, where Ethereum would be considered below fair value but rising in appeal. At its current price, ETH is currently in this zone.
The “HODL!” band, which spans from $3,239 to $4,668. This band reflects neutral-to-positive sentiment. Above it is the so-called “Is this a bubble?” zone, ranging from $4,668.12 to $6,780.45, where price momentum begins to spark market caution.
Higher up, the “FOMO Intensifies” range goes from $6,780.45 to $9,865.96 and signals growing speculative fervor. If the price goes up even more, it will hit the “Sell. Seriously, SELL!” zone ranging from $9,865 to $14,109 and suggesting peak market heat.
The uppermost zone, the “Maximum Bubble Territory” band, ranges from $14,109 to $20,116.86 and suggests extreme overvaluation.
Ethereum price analysis
At press time, Ethereum is trading at $2,478, a -5.88% dip in the past 24 hours.

This places it somewhere in the middle of the “Still Cheap” zone, implying it is trading below fair value and likely to rise in appeal soon.
Indeed, upcoming upgrades like Fusaka and Glamsterdam could boost Ethereum’s throughput and bullish long-term prospects. However, rising leverage could also increase volatility risk.
Further bearish signals include a Moving Average Convergence/Divergence (MACD) histogram of -40 and a Relative Strength Index (RSI) of 46.72, which suggest consolidation.
Featured image via Shutterstock
Read the full article here
