


After a sharp retreat from the $2,640 zone earlier this week, the Ethereum price today is consolidating near $2,523. The broader chart structure shows ETH is compressing within a symmetrical triangle, with key support near $2,480 and visible resistance at $2,560. Multiple indicators suggest the asset is preparing for its next directional move — but can bulls maintain their control?
What’s Happening With Ethereum’s Price?
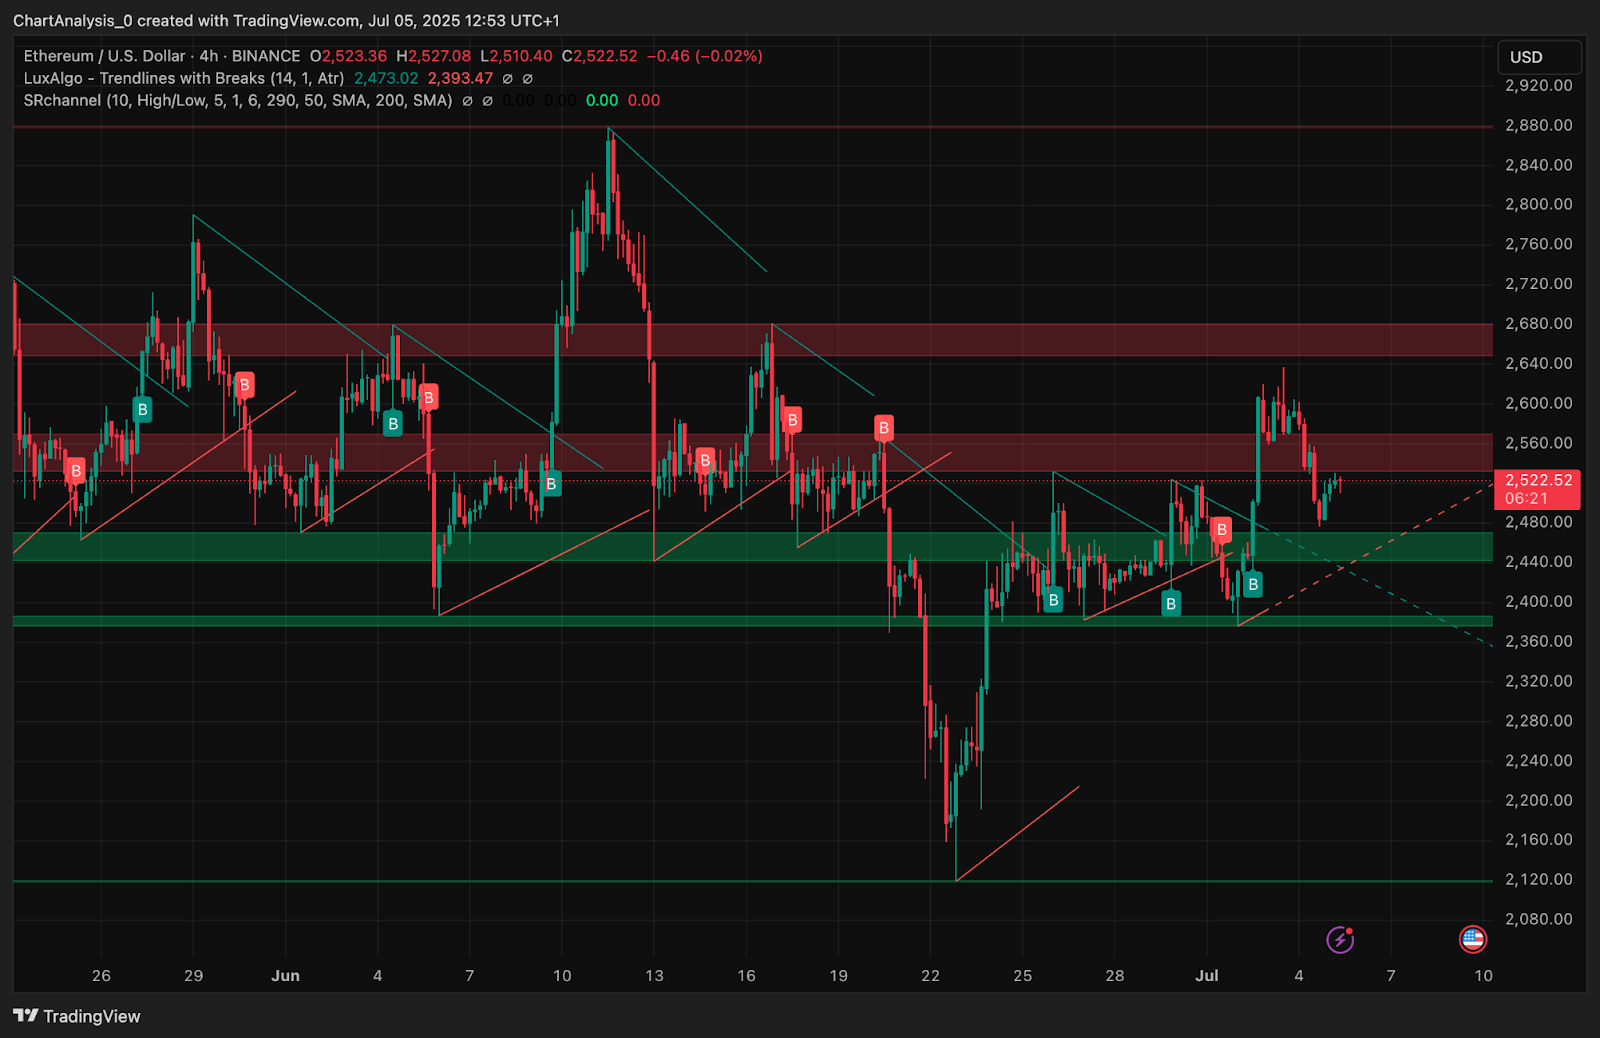
ETHUSD price dynamics (Source: TradingView)
On the 4-hour chart, Ethereum has rebounded from the $2,450 zone, reclaiming the mid-Bollinger Band and stabilizing just above the 100 EMA at $2,486. All four EMAs (20/50/100/200) are now clustering tightly between $2,486 and $2,525, indicating a pivotal area for ETH. A decisive move from this level is likely to determine whether Ethereum price action turns bullish or retreats.
ETHUSD price dynamics (Source: TradingView)
Structurally, ETH continues to respect a broad ascending triangle formed since early June, with higher lows seen near $2,240 and a horizontal ceiling near $2,560. The current candle structure shows reduced volatility and tightening price action — a classic setup for breakout continuation or breakdown reversal.
Why Is The Ethereum Price Going Down Today?
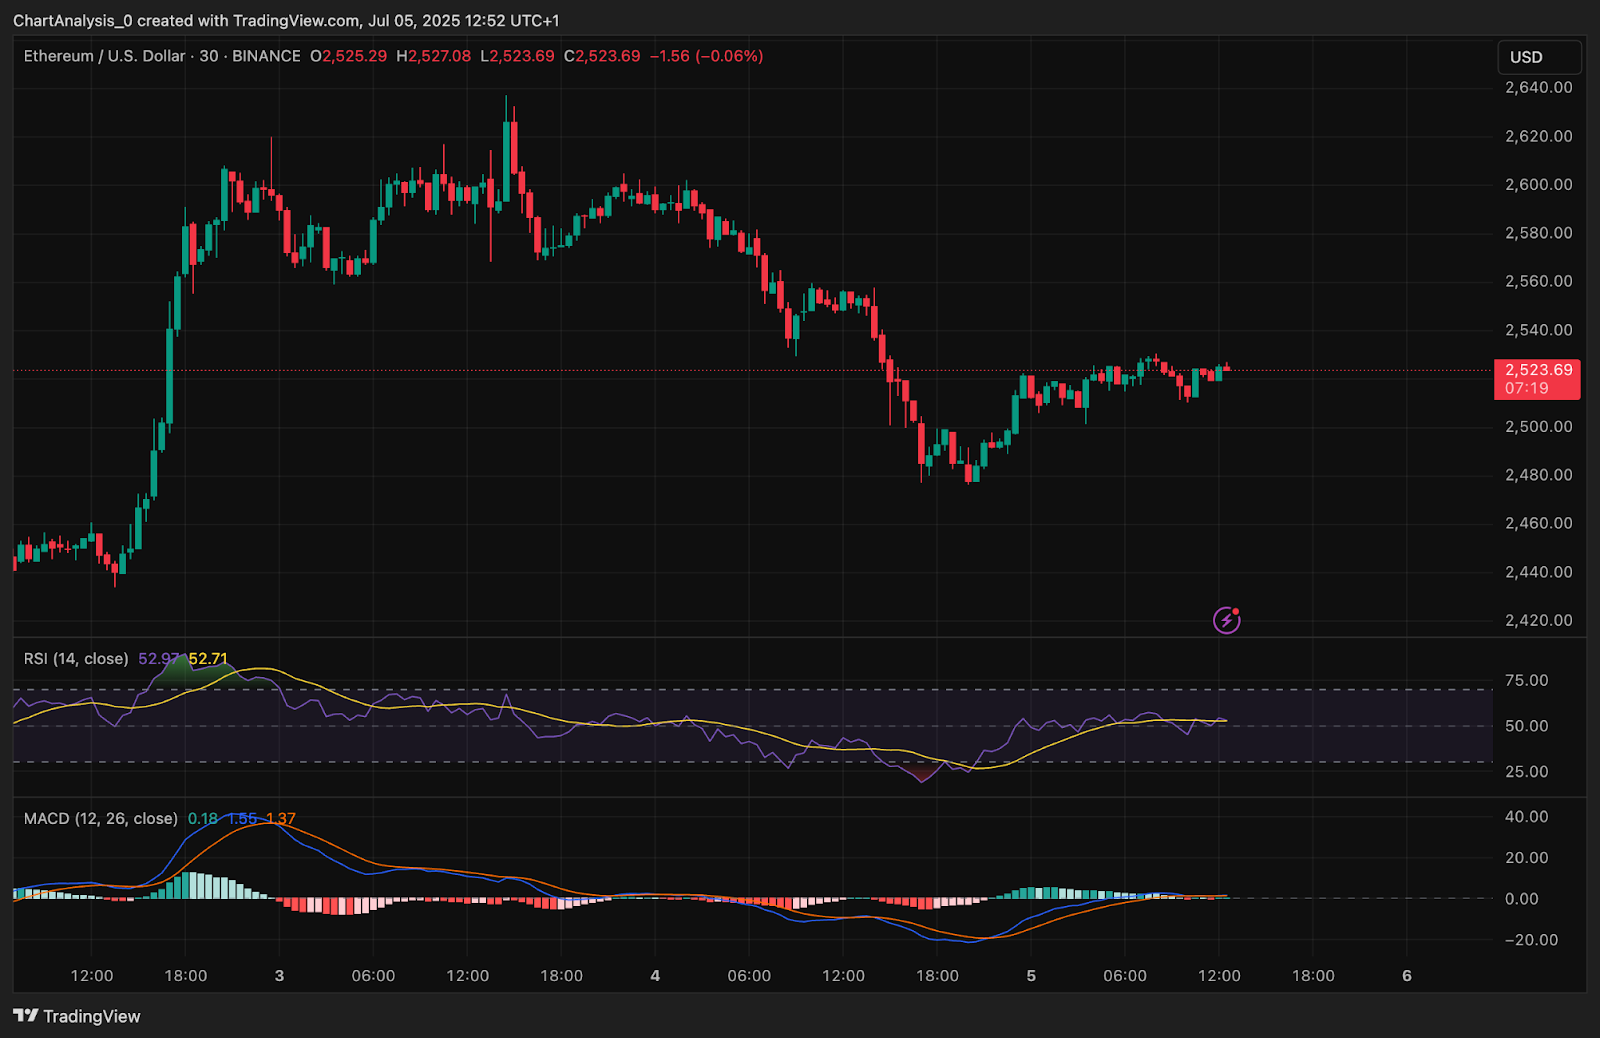
ETHUSD price dynamics (Source: TradingView)
The recent dip in Ethereum price can be attributed to overhead rejection from the $2,640–$2,660 resistance band, where selling pressure consistently halted upside attempts. As seen in the RSI and MACD on the 30-minute chart, momentum weakened sharply after failing to close above $2,630.
Why Ethereum price going down today also relates to bearish divergence spotted earlier this week, where the RSI formed lower highs while price action attempted higher highs. This was followed by a downward crossover in MACD and a drop below the VWAP zone.
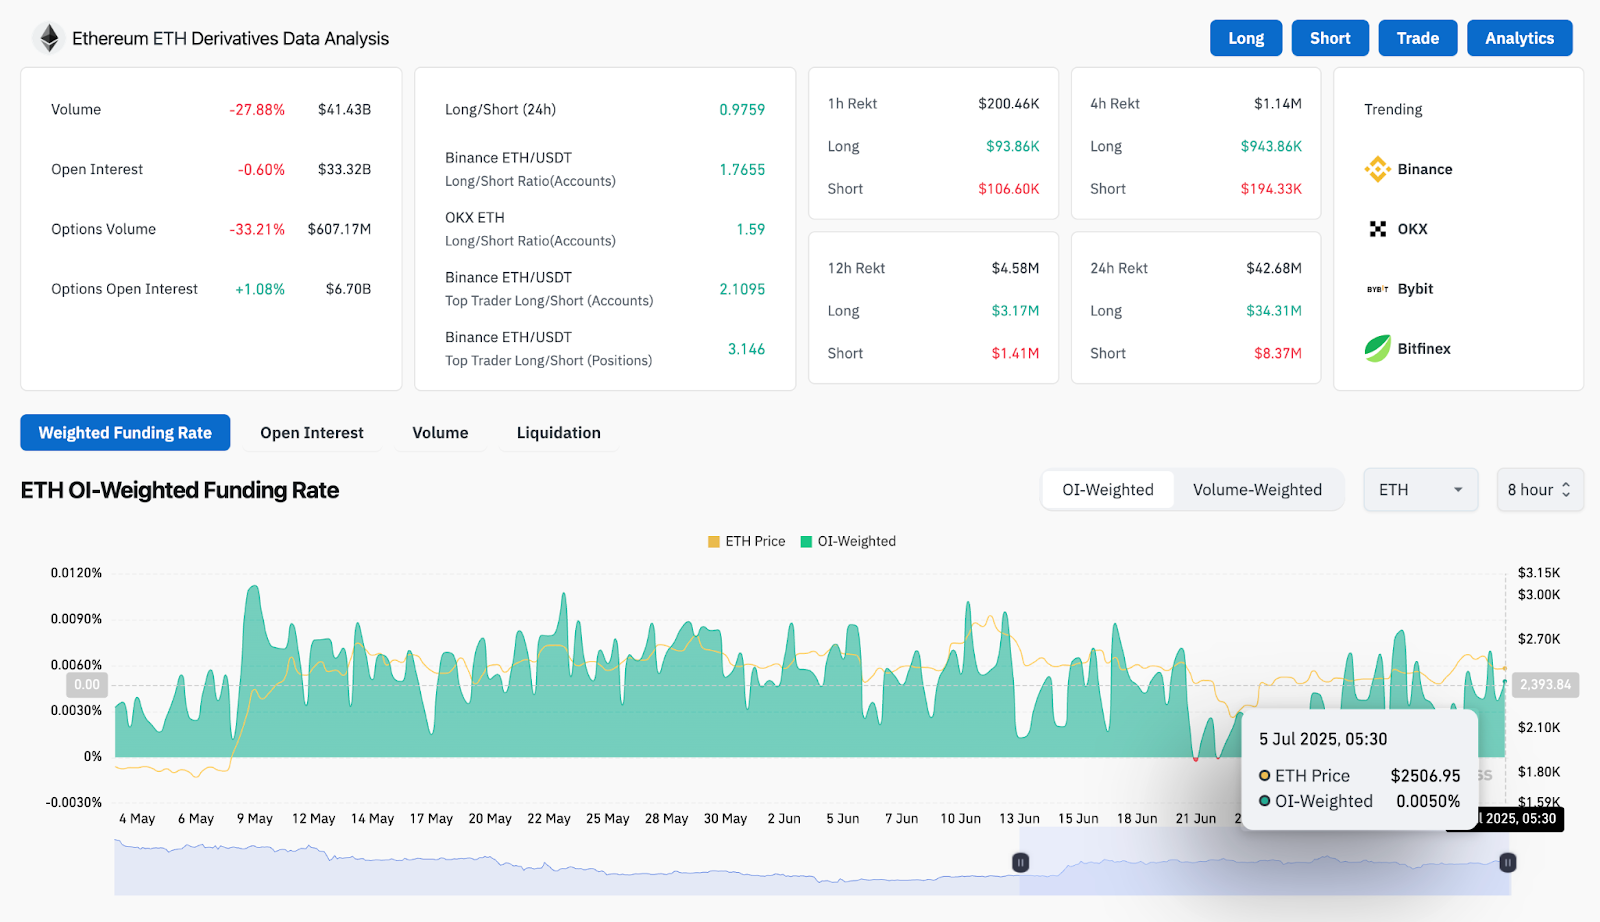
ETH Derivative Analysis (Source: Coinglass)
Open interest data shows a slight -0.6% contraction, and 24-hour liquidations have totaled $42.68 million, with more short-side pressure than long-side support. While the long/short ratio on Binance remains slightly bullish (2.10), a breakdown below $2,480 could invite another round of stop-triggered selling.
Key Signals From Price Indicators and Volatility Charts
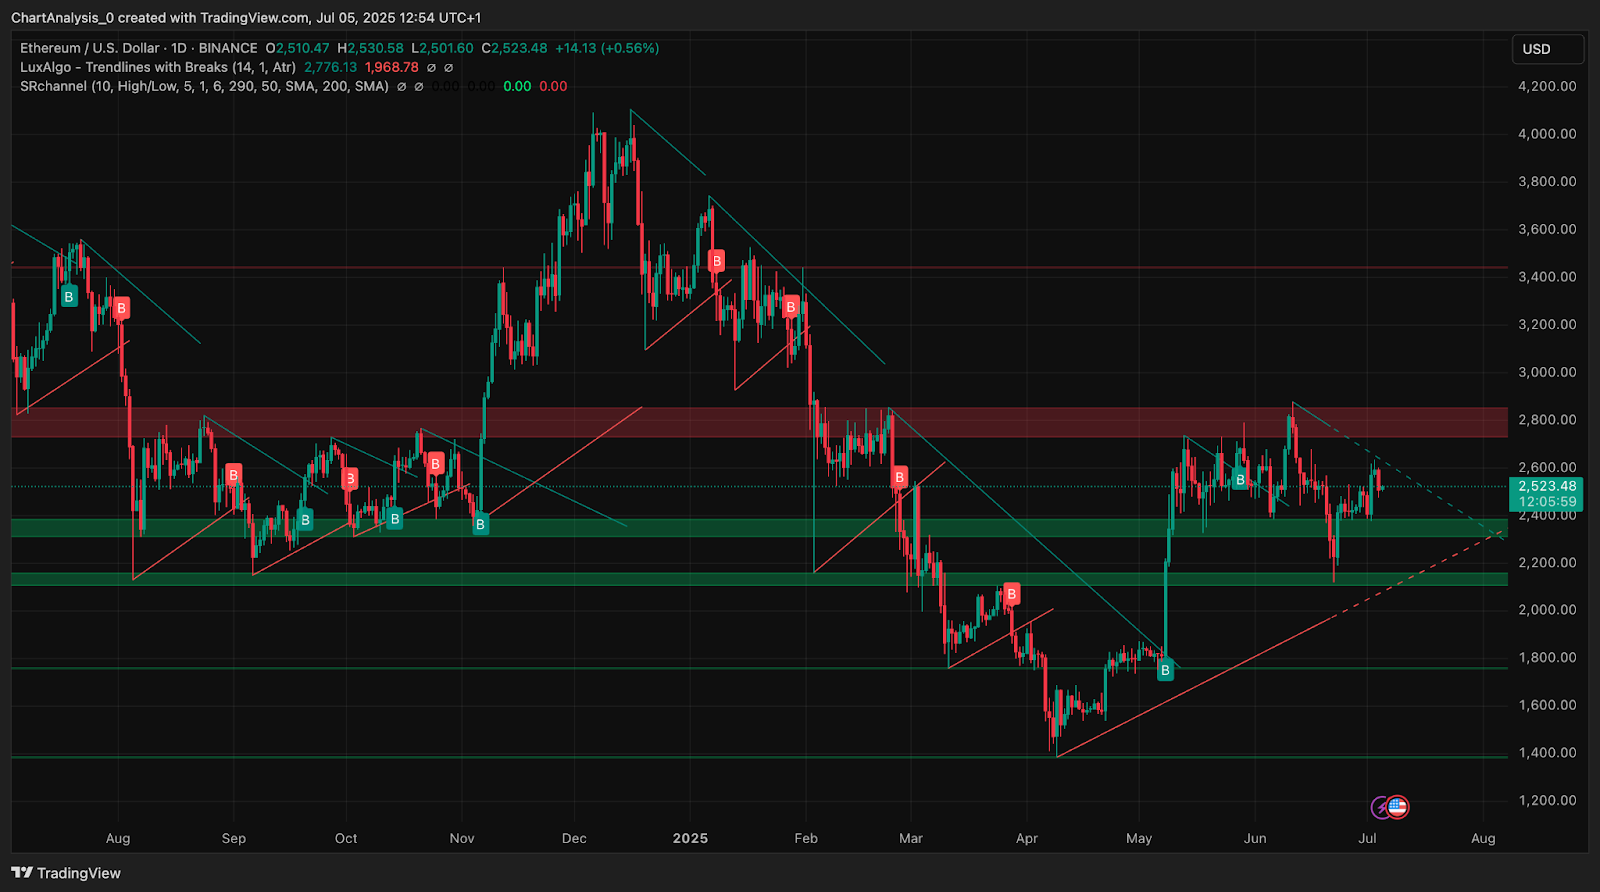
ETHUSD price dynamics (Source: TradingView)
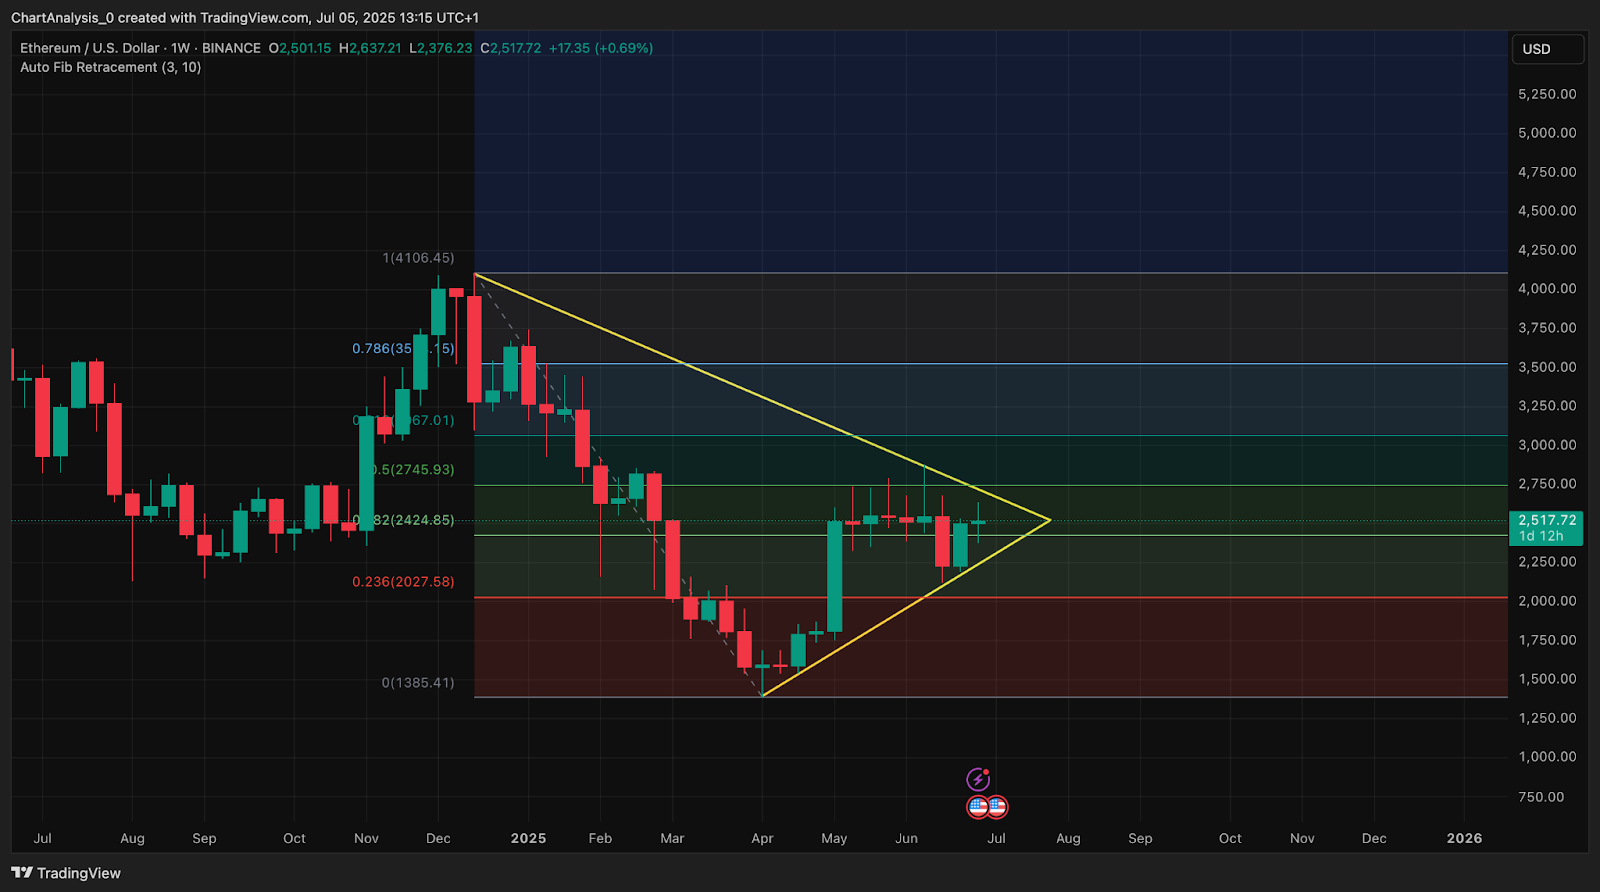
On the 1-day chart, Ethereum is still inside a large symmetrical triangle, bounded by resistance near $2,760 and support above $2,240. Fibonacci levels drawn from the $4,100 high to the $1,385 bottom show ETH reclaiming the 0.382 zone ($2,424), with the next major hurdle being the 0.5 retracement level at $2,745.
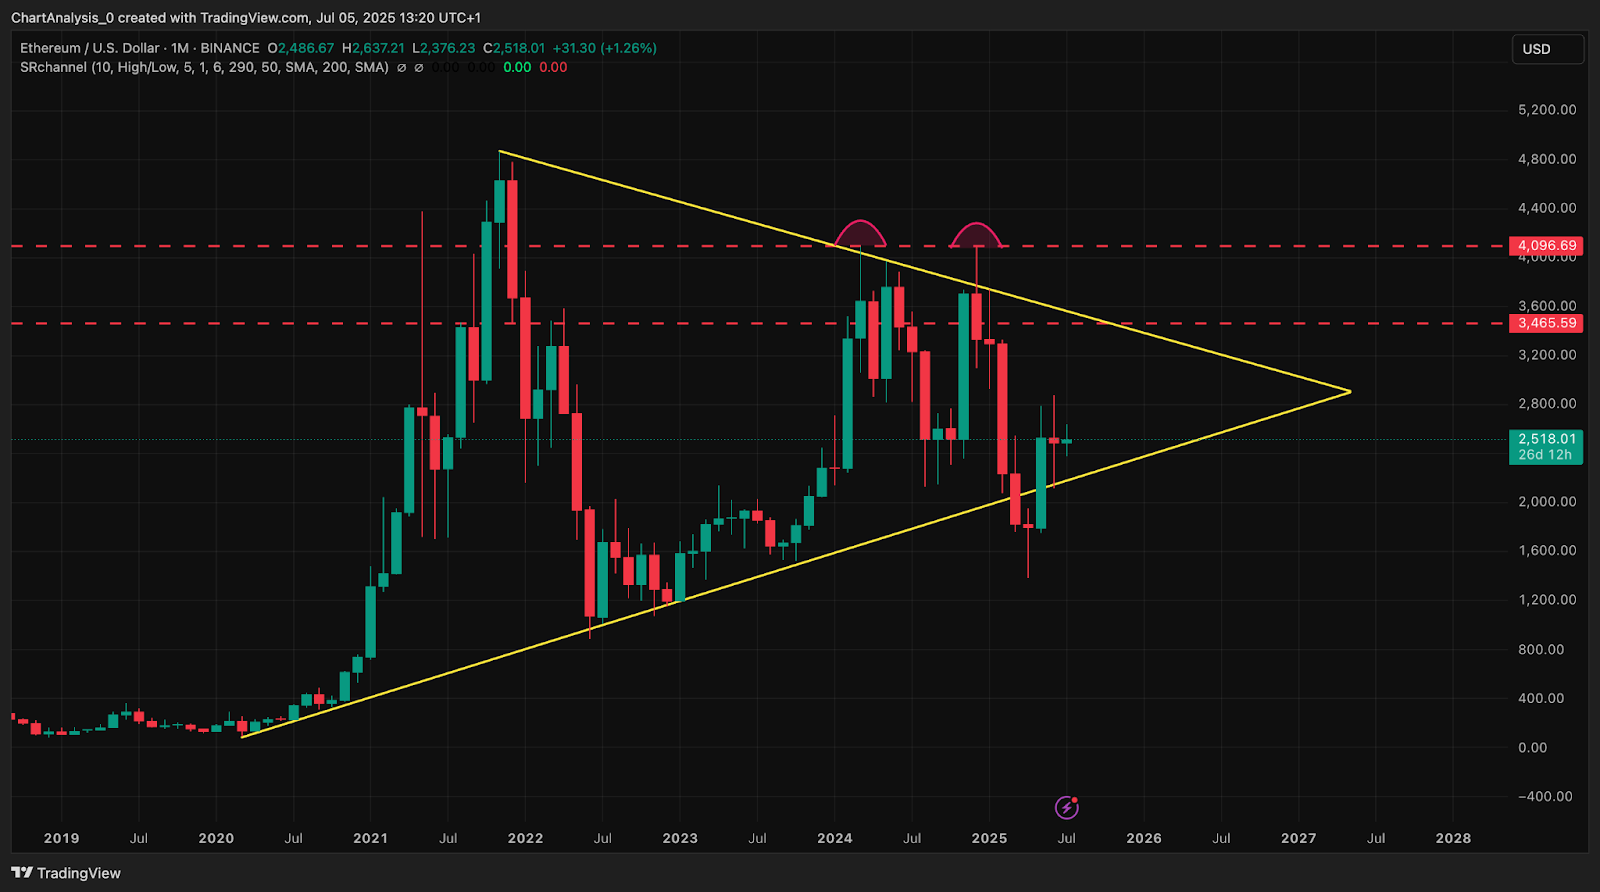
Zooming out, the monthly chart reveals a long-term symmetrical triangle that has been developing since late 2021. ETH is now testing the upper boundary of this structure for the third time after bouncing from a multi-year ascending trendline. Notably, this triangle contains two significant lower highs that align with rejection zones near $3,465 and $4,096 — key macro resistance levels. A decisive breakout above this triangle would signal a major trend reversal, potentially setting up Ethereum for a retest of its all-time highs.
ETH Price Prediction: Short-Term Outlook (24h)
ETHUSD price dynamics (Source: TradingView)
The short-term outlook remains cautiously bullish as long as ETH holds above $2,480. Reclaiming $2,560 with volume confirmation could open a retest of the $2,600–$2,640 liquidity pocket. A clean close above that level would suggest a breakout from the triangle and continuation toward $2,745.
On the downside, a failure to hold $2,480 could result in a quick drop toward the $2,424 support (Fib 0.382), and then $2,360, where prior breakouts have previously held.
Given the current low volatility, Ethereum price volatility is expected to increase as the triangle apex nears. Traders should watch the $2,480–$2,560 zone closely, as any breakout or breakdown from this range could trigger a multi-day trend.
Ethereum Price Forecast Table: July 6, 2025
Disclaimer: The information presented in this article is for informational and educational purposes only. The article does not constitute financial advice or advice of any kind. Coin Edition is not responsible for any losses incurred as a result of the utilization of content, products, or services mentioned. Readers are advised to exercise caution before taking any action related to the company.
Read the full article here


 as Price Consolidates in a Tight Range")
