


Quant price is on the verge of a 47% surge to its December high as the supply on exchanges falls and those held by top addresses jump.
Quant (QNT) rose to a high of $116 on Wednesday, up by 95% from its lowest level in April this year. It is hovering near its highest point since January.
QNT has some solid fundamentals as the real-world asset tokenization industry grows. RWA data shows that over $23 billion of assets have been tokenized, while the number of asset holders has jumped by 13% in the last 30 days to 113,794.
Quant plays a role in the RWA industry through its overledger solution. Overledger is a blockchain operating system that enables interoperability between different blockchain networks and legacy systems.
Overledger is made up of transaction, messaging, and application layers. The transaction layer stores verified transactions, while the messaging one filters and orders messages to ensure compliance. The application layer sets rules for blockchain interactions, facilitating cross-chain functions.
Notable organizations like the Bank of England, Oracle, Amazon, and BNY Mellon have embraced Quan’s technology. Most recently, it was named as a key player in the development of a digital euro by the European Central Bank.
On-chain data shows that the supply of Quant held by top addresses has continued rising in the past few months. These accounts hold 3.58 million tokens, up from 3.54 million in March. At the same time, the supply in exchanges has fallen from 1.7 million on May 20 to 1.67 million today.
Quant’s network has also become more popular among users. Its active addresses in the last 30 days has been in a strong upward trajectory.
Quant price technical analysis

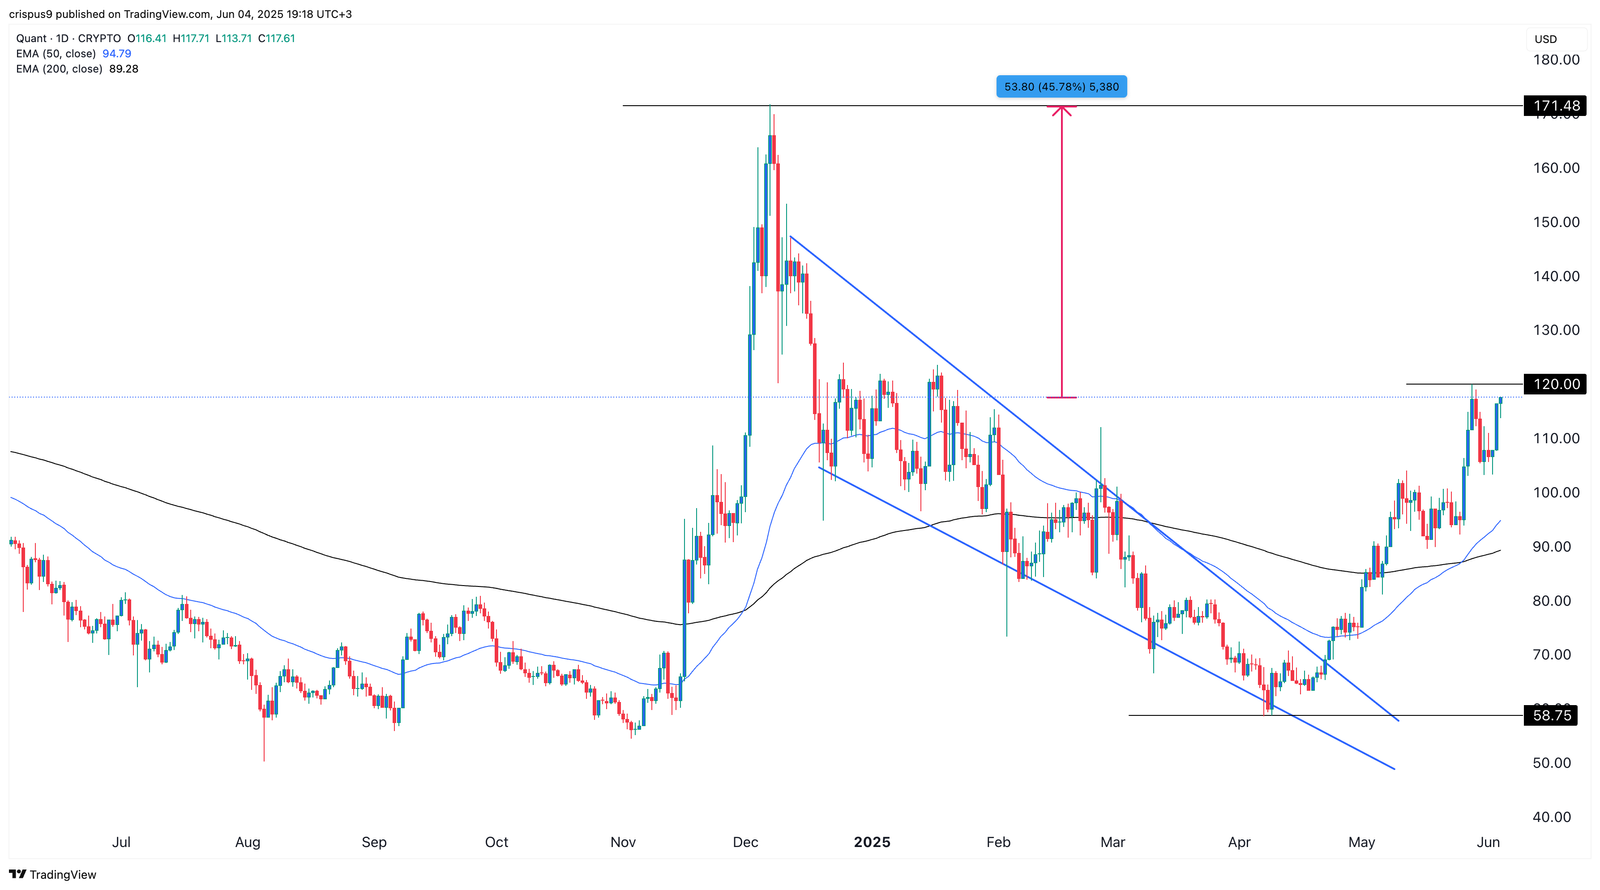
The daily chart shows that the QNT price has been in a strong uptrend in the past two months. This surge happened after the coin dropped to a low of $58.75 as the crypto market sell-off intensified.
Quant price has already formed a golden cross pattern as the 200-day and 50-day moving averages crossed each other. This pattern often leads to more gains in the long term.
The coin now faces a major hurdle at $120, its highest point on May 28. A move above that price will point to more gains, potentially to the November high of $171.48, up by 45% above the current level.
Read the full article here


