Ripple’s price has been consolidating over the last few months, as Bitcoin has reached new all-time highs. XRP investors are hopeful that things might be about to change soon.
XRP Price Analysis
By Edris Derakhshi (TradingRage)
The USDT Paired Chart
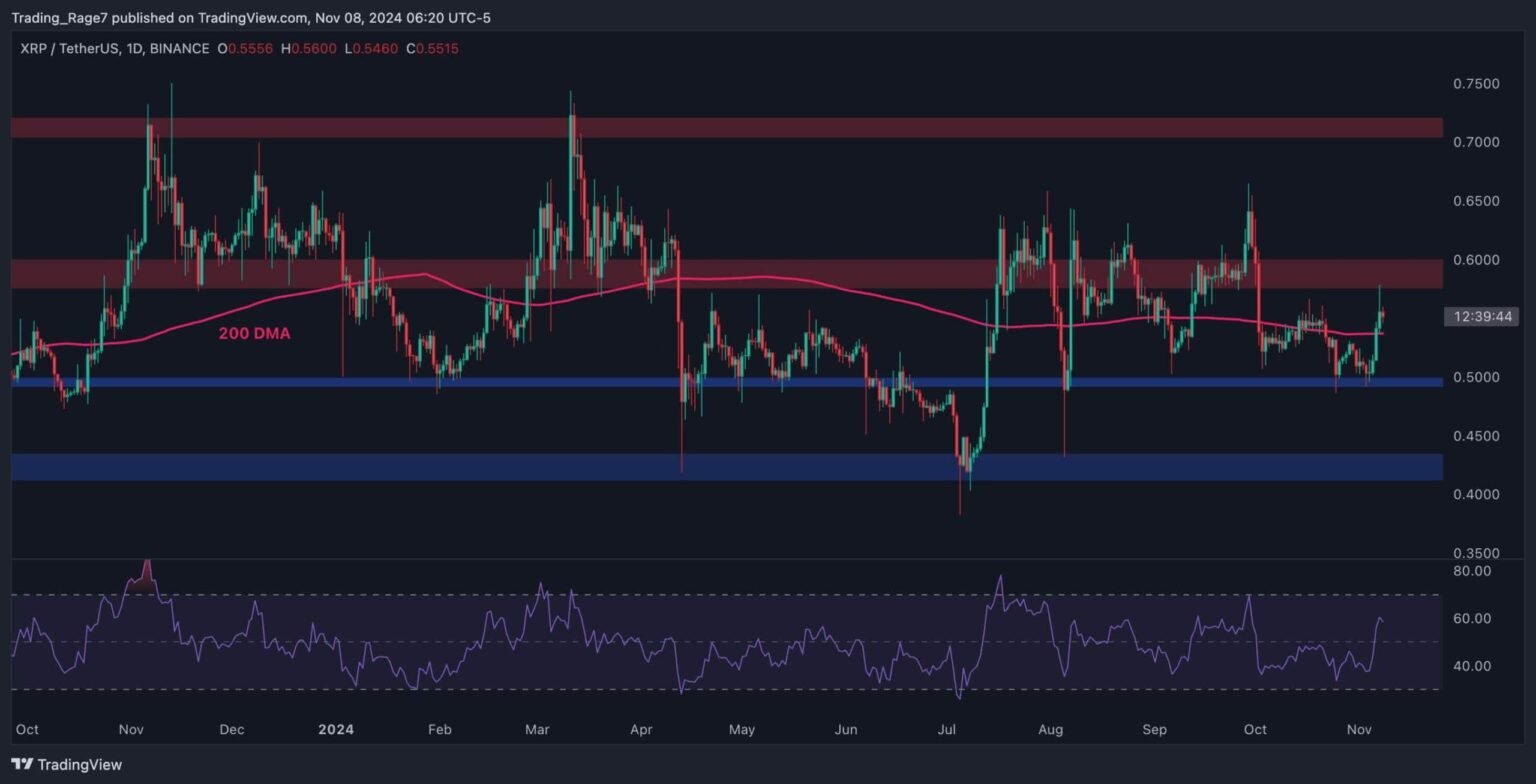
The USDT paired chart shows a choppy rangebound price action over the last few months.
The cryptocurrency mainly oscillated around the 200-day moving average and failed to break to either side of the range between the $0.6 and $0.5 levels.
Yet, as BTC has once again set a new record high, it seems probable that XRP will rise higher toward at least the $0.7 level in the upcoming months.
The BTC Paired Chart
The XRPBTC pair shows a completely different perspective, as Ripple has been rapidly depreciating against Bitcoin over the last year.
The price has recently bounced above the 200-day moving average but has failed to keep above it and has dropped again as Bitcoin began to rally.
At the moment, a decline toward the 600 SAT level seems imminent. Yet, if held intact, this level could overturn Ripple’s price trend and initiate a rally for XRP against both BTC and USDT.
Read the full article here
