


Ethereum’s price has been going through a horrifying crash, as the second largest crypto has lost more than half of its value over the past few months.
What’s next for ETH?
Technical Analysis
By Edris Derakhshi (TradingRage)
The Daily Chart
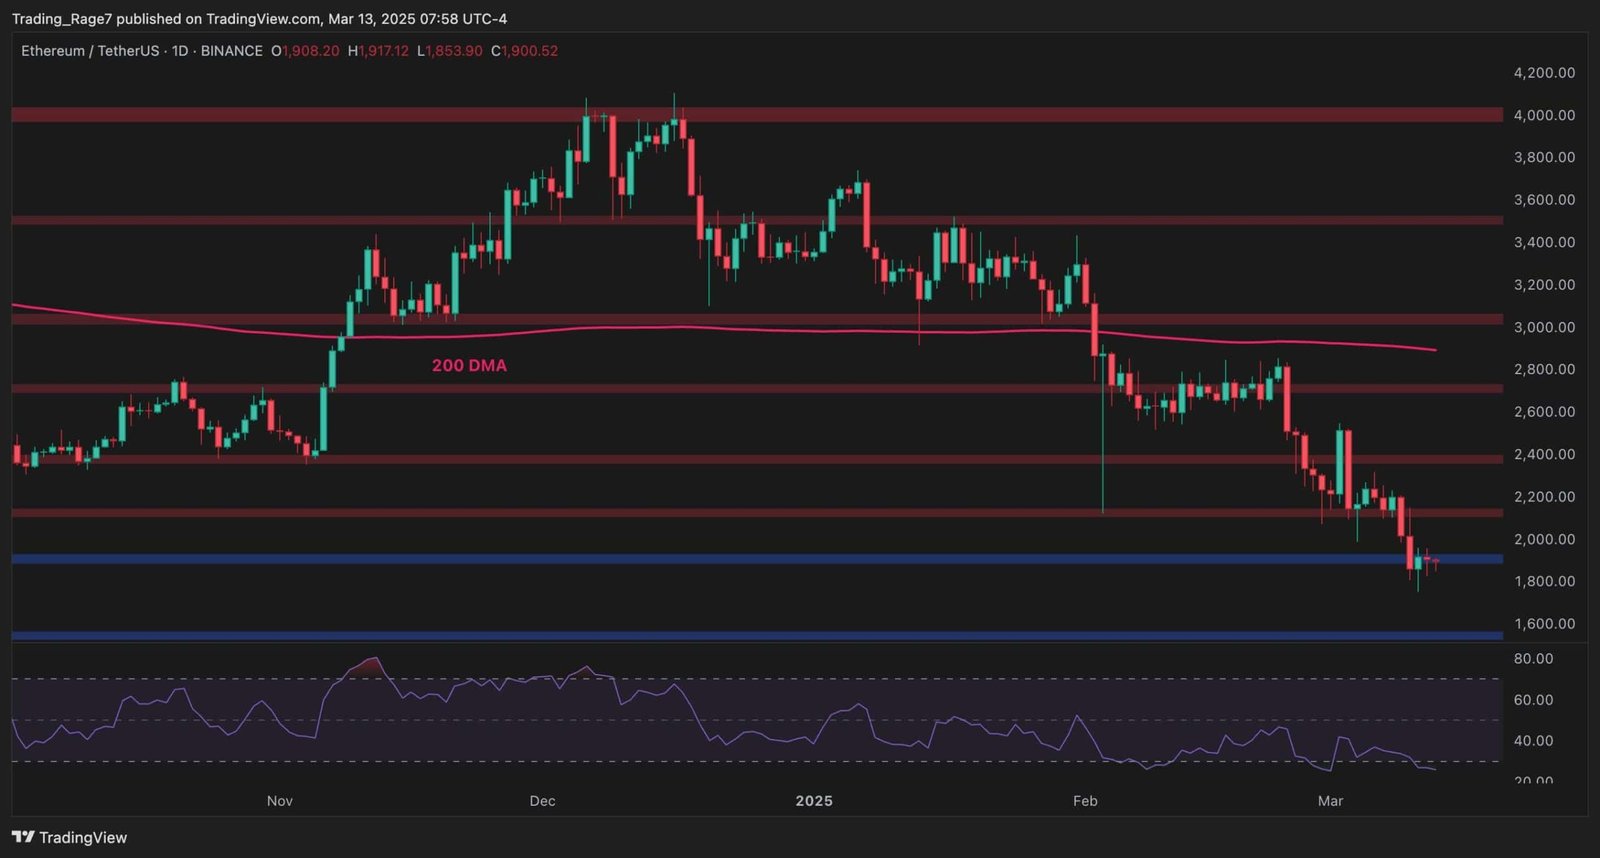
The Ethereum daily chart shows a clear downtrend over the past few weeks, with the price consistently making lower highs and lower lows. The breakdown below multiple key support levels, including the 200-day moving average (DMA), signaled a shift in market sentiment toward bearishness.
Recently, ETH has dropped below the psychological $2,000 level, testing a significant support zone around $1,900. If selling pressure continues, further downside potential toward $1,600 exists.
The RSI is also hovering in oversold territory, suggesting a possible short-term bounce. However, as long as ETH remains below the key $2,400 level, any recovery could be temporary. Bulls need to reclaim this level and the 200-day moving average to reverse the downtrend, while further weakness could lead to a deeper correction.
The 4-Hour Chart
The 4-hour chart shows a descending wedge formation, which is typically a bullish reversal pattern. The price is now testing the $1,900 support zone, and if the level holds, it may attempt to push higher toward $2,000 and possibly the $2,100 resistance line. However, failure to rebound from the $1,900 could lead to a breakdown of the wedge, which could make everything much worse.
On the other hand, a decisive breakout above the wedge with strong volume could confirm a bullish reversal, while continued consolidation or rejection at resistance may indicate further downside pressure.


Sentiment Analysis
By Edris Derakhshi (TradingRage)
Open Interest
The Ethereum Open Interest (OI) chart provides valuable insights into market positioning and trader sentiment. We can observe a significant decline in both price and OI, suggesting a strong deleveraging event.
Historically, spikes in OI followed by rapid drops indicate liquidation cascades, where overleveraged long positions are flushed out, often leading to further downward momentum. The recent OI drop aligns with ETH breaking below key support levels around $2,000 and falling toward $1,800.
Given this data, ETH might be in a phase of reduced speculation as traders close positions amid uncertainty. This aligns with the technical analysis, where ETH has struggled to reclaim key resistance levels. However, a stabilization in OI could indicate that the worst of the sell-off is over, setting up conditions for a potential relief rally.
Yet, for a sustainable recovery, Open Interest must start rising again alongside price, confirming fresh capital entering long positions rather than just short squeezes. Until then, further downside remains possible, especially if ETH fails to hold the $1,800 support zone.

Read the full article here


