Close Menu
  • Crypto News
  • Markets
  • Bitcoin
  • Ethereum
  • XRP
  • Altcoins
  • Technology
  • More
    • Crypto Prices – Latest from BTC, ETH & XRP
    • NFT
    • DeFi

Subscribe to Updates

Get the latest crypto news and updates directly to your inbox.

Trending

How Many Bitcoins Have Been Lost Forever? Latest Data Revealed, Here’s the True Maximum BTC Supply

June 7, 2025

Song A Day creator recounts ‘tax nightmare’ after making millions from NFT sale

June 7, 2025

Solana stablecoin supply dip led by $1.8B USDC outflow

June 7, 2025

Cryplex AI and Accumulate (L1 Blockchain) Form Partnership to Boost Decentralized AI and Identity

June 7, 2025

Metaplanet to Raise $5.3B, Japan’s Largest Stock Warrant Deal, to Grow Bitcoin Stash

June 7, 2025
Facebook X (Twitter) Instagram
  • Advertise
en English
nl Nederlandsen Englishfr Françaisde Deutschit Italianoru Русскийes Españolzh-CN 简体中文hi हिन्दीja 日本語
Crypto Observer
  • Crypto News

    Traders Turn Bearish on Bitcoin Following High-Profile Political Tensions, Data Shows

    June 7, 2025

    $250K Prediction Still In Play

    June 7, 2025

    The Head And Shoulders Pattern That’s Forming

    June 7, 2025

    Bitcoin Sees Largest Net Taker Volume Drop Of 2025 – Traders React To Trump-Elon Clash

    June 6, 2025

    Musk Clashes With Trump—Dogecoin Is Caught In The Crossfire

    June 6, 2025
  • Markets
  • Bitcoin
  • Ethereum
  • XRP
  • Altcoins
  • Technology
  • More
    • Crypto Prices – Latest from BTC, ETH & XRP
    • NFT
    • DeFi
Facebook X (Twitter) Instagram
Crypto Observer
Home » Crypto News » DOT Price Analysis: Is Polkadot Due for Massive Volatility Around $6?
Crypto News

DOT Price Analysis: Is Polkadot Due for Massive Volatility Around $6?

Crypto Observer StaffBy Crypto Observer StaffApril 17, 2024No Comments3 Mins Read
Facebook Twitter Pinterest Reddit Telegram Email LinkedIn Tumblr
Share
Facebook Twitter LinkedIn Pinterest Email

Polkadot’s price has seen a significant decline and found support around the critical $6 mark, exhibiting slight fluctuations indicative of low volatility.

However, it’s noteworthy that the cryptocurrency remains firmly within a pivotal range, hinting at an imminent breakout.

Polkadot Price Analysis: Technicals

By Shayan

The Daily Chart

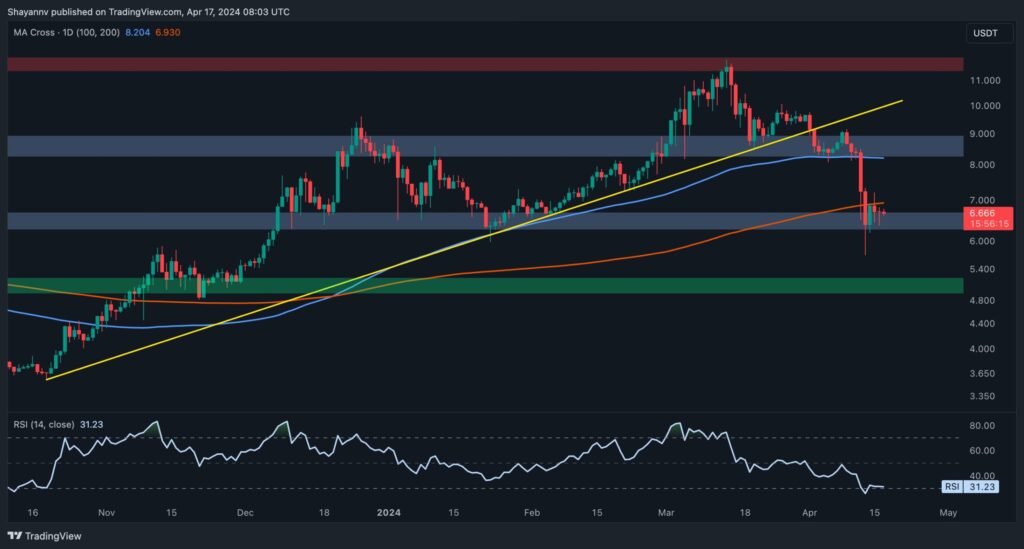
An in-depth examination of the daily chart reveals a period of subdued price action and sideways consolidation near the $6 mark following a substantial drop below the 100 and 200-day moving averages. This pattern reflects an overall bearish market sentiment, with sellers currently in control.

However, Polkadot is presently contained within a decisive range, marked by the support at $6 and the significant 200-day moving average at $6.93.

A bullish surge above the 200-day moving average could pave the way for sustained upward momentum, targeting the pivotal $10 mark. Conversely, if the bearish momentum persists, a continuation of the downtrend toward the substantial $5 support level becomes increasingly likely.

The 4-Hour Chart

A detailed analysis of the 4-hour timeframe indicates that following a notable drop triggered by a significant long-squeeze event, the downward momentum was met with intensified demand, leading to a modest rebound near the critical $6 level.

Moreover, a visible bullish divergence between the price and the RSI indicator on the 4-hour chart also suggests the potential for corrective retracements in the short term. In this scenario, DOT will be more likely to continue its corrective movement, with the next targets lying within the price range between the 0.5 ($7.4) and 0.618 ($7.8) Fibonacci levels.

In summary, Polkadot remains within a pivotal range, bounded by $6 and $9 in the broader perspective, and is expected to oscillate within this range until a breakout occurs.

dot_price_analysis_chart_1704242

Sentiment Analysis

By Shayan

During the recent movements, the perpetual futures segment has exerted considerable influence over crypto prices. When this market becomes overheated, characterized by aggressive long and short positions, it tends to spur heightened volatility and sudden price shifts. Thus, gauging the futures market’s state is a valuable tool for predicting incoming dynamics.

A relevant metric in this evaluation is Polkadot’s Open Interest (OI) chart, which tracks the sentiment within the futures market alongside price movements. It quantifies the number of open perpetual futures contracts across various crypto exchanges. Typically, higher OI values correlate with increased volatility, and conversely, lower values signify calmer market conditions.

Examining the following chart reveals a notable downturn in both the OI metric and the price of Polkadot. This decline coincides with recent geopolitical tensions in the Middle East, which have exerted downward pressure on market sentiment. The substantial drop in Open Interest primarily stems from the liquidation of a significant number of long positions in the perpetual markets.

Consequently, the market appears to be undergoing a period of cooling off, potentially setting the stage for a renewed influx of both long and short positions in the futures market. This, in turn, could catalyze a fresh surge in market activity and raise the possibility of intensified volatility.

dot_open_interest_chart_1704241


This post is powered by Polkadot. 

Read the full article here

Share. Facebook Twitter Pinterest LinkedIn Tumblr Email

Related Posts

Traders Turn Bearish on Bitcoin Following High-Profile Political Tensions, Data Shows

June 7, 2025

$250K Prediction Still In Play

June 7, 2025

The Head And Shoulders Pattern That’s Forming

June 7, 2025

Bitcoin Sees Largest Net Taker Volume Drop Of 2025 – Traders React To Trump-Elon Clash

June 6, 2025
Add A Comment

Leave A Reply Cancel Reply

Subscribe to Updates

Get the latest crypto news and updates directly to your inbox.

Top Posts

How Many Bitcoins Have Been Lost Forever? Latest Data Revealed, Here’s the True Maximum BTC Supply

June 7, 2025

Song A Day creator recounts ‘tax nightmare’ after making millions from NFT sale

June 7, 2025

Solana stablecoin supply dip led by $1.8B USDC outflow

June 7, 2025
Advertisement
Demo

Crypto Observer is your one-stop website for the latest crypto news and updates, follow us now to get the news that matters to you.

Facebook X (Twitter) Instagram
Crypto News

$250K Prediction Still In Play

June 7, 2025

The Head And Shoulders Pattern That’s Forming

June 7, 2025

Bitcoin Sees Largest Net Taker Volume Drop Of 2025 – Traders React To Trump-Elon Clash

June 6, 2025
Get Informed

Subscribe to Updates

Get the latest crypto news and updates directly to your inbox.

Facebook X (Twitter)
  • Privacy Policy
  • Terms of use
  • Advertise with us | Publishing
  • Contact us
  • Crypto News – Press release
  • Newsletter sign up
  • Markets
  • Altcoins
  • Bitcoin
  • Crypto News
  • DeFi
  • Ethereum
  • Technology
  • Blockchain
  • AI
  • NFT
  • Thanks for joining us
© 2025 Crypto Observer. All Rights Reserved.

Type above and press Enter to search. Press Esc to cancel.