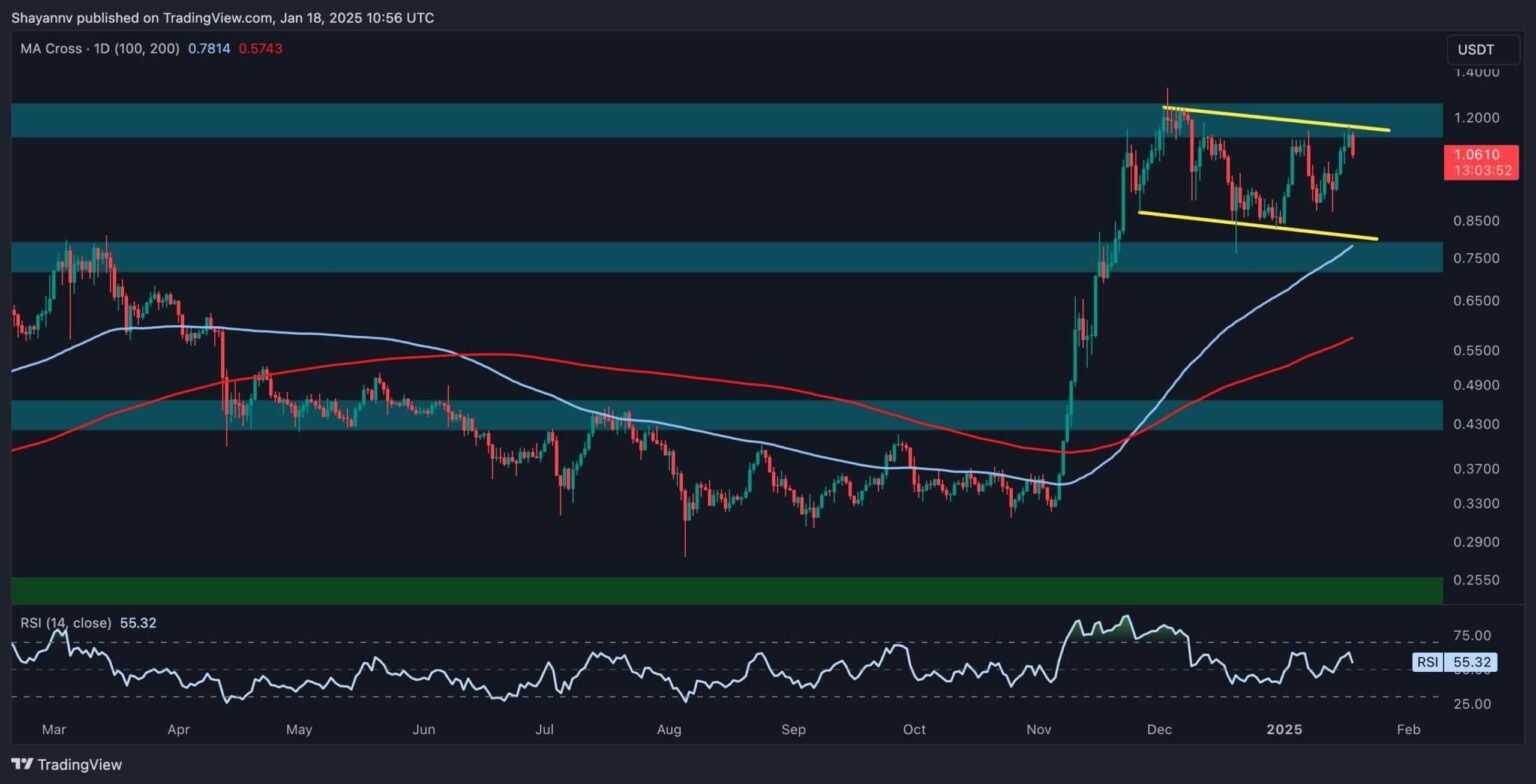
Cardano is consolidating within a critical price range, with the recent action suggesting buyers’ determination to overcome the $1.3 resistance threshold.
However, the movements at this juncture are pivotal in shaping ADA’s next market trend.
Technical Analysis
By Shayan
The Daily Chart
Cardano recently witnessed significant buying interest near the $0.87 support level, sparking a sharp price increase. This bullish momentum has driven the asset toward the $1.3 resistance region, a key level due to its alignment with the descending wedge’s upper boundary.
The $1.3 resistance presents a formidable challenge as it combines psychological significance with technical importance. Breaking above this level could signal the beginning of a mid-term uptrend, potentially targeting the $2 resistance zone. However, failure to break out could lead to prolonged consolidation or even a bearish reversal.
The 4-Hour Chart
On the 4-hour timeframe, ADA recently broke out of a descending wedge pattern, initiating a surge from the wedge’s broken trendline at $0.87. The price has since approached the $1.3 resistance, which aligns with a previous major pivot point, further solidifying its significance.
Currently, Cardano is consolidating at nearly $1.3, with signs of seller pressure emerging. A bearish divergence between the price and the RSI indicator suggests growing selling momentum.
To determine the next major move, ADA needs a decisive breakout above this consolidation range. A bullish breakout could trigger a sustained rally, targeting higher levels like $2, while a rejection at $1.3 might result in further declines, with potential support near $0.87.
Read the full article here
