


Reason to trust
Strict editorial policy that focuses on accuracy, relevance, and impartiality
Created by industry experts and meticulously reviewed
The highest standards in reporting and publishing
Strict editorial policy that focuses on accuracy, relevance, and impartiality
Morbi pretium leo et nisl aliquam mollis. Quisque arcu lorem, ultricies quis pellentesque nec, ullamcorper eu odio.
Este artículo también está disponible en español.
The Bitcoin price has just printed a rare Golden Cross on the weekly chart — a technical signal that historically appears once every market cycle. This Golden Cross has previously preceded some of Bitcoin’s most explosive bull runs, and analysts are eyeing its return as a sign that the next bullish leg up could be near.
A Golden Cross occurs when a shorter-term Moving Average (MA), usually the 50-week MA, crosses above a longer-term one, like the 20-week MA. In the crypto world, this technical formation is perceived as a significantly bullish indicator that often leads to a long-term trend reversal or the start of a new uptrend. While the signal alone doesn’t guarantee gains, Bitcoin’s price history suggests it’s one worth watching closely.
Bitcoin Price Flashes Super Rare Golden Cross
Related Reading
In 2016, Bitcoin recorded a massive surge of 139% after flashing a Golden Cross on its price chart. Similarly, in the 2017 bull cycle, the flagship cryptocurrency underwent another crossover, which led to an astonishing 2,200% increase, marking one of its most parabolic rallies and capturing the attention of the world.
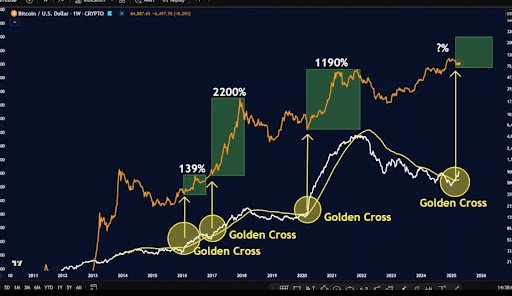
In 2020, during the historic bull market that led to Bitcoin’s global exposure and dominance, the same Golden Cross pattern was formed. Following this, Bitcoin recorded a 1,190% rally, pushing its price to its then all-time high near $69,000 in 2021.
Now, in 2025, five years after the previous Golden Cross appearance, Bitcoin has once again printed this powerful signal and could be on the verge of another historic rally. The analyst’s price chart shows the crossover forming clearly, with many comparisons to the previous cycle setups
While the exact percentage price increase this time remains unknown, the consistency of the pattern has sparked the analyst’s prediction that Bitcoin may be gearing up for a powerful rally above $200,000.
Analyst Predicts BTC’s Next ATH Target
In another similarly bullish Bitcoin price analysis, Crypto Caeser, an analyst on X, has projected that the flagship cryptocurrency will soon hit a new ATH this cycle. While many suggest that the Bitcoin price surge above $109,000 during US President Donald Trump’s inauguration was its market top, a significant portion of the community still expect a rally to a higher peak before a bear market.
Related Reading
Sharing a Bitcoin price chart that outlines its possible bullish trajectory, Crypto Caeser predicts that the flagship cryptocurrency could be heading to a “weak high” of $110,000. The analyst has pinpointed a key support zone around $90,000, emphasizing that this was the most optimal price level for maximum buying.

Featured image from Pixabay, chart from Tradingview.com
Read the full article here


