


After reclaiming the $105,000 level in early June, Bitcoin price today is showing signs of short-term hesitation. The broader market remains cautious, with Bitcoin price hovering around the mid-$105,000s as traders assess resistance just under $106,000. While bullish momentum remains intact on higher timeframes, key indicators hint at consolidation risks heading into June 10.
What’s Happening With Bitcoin’s Price?
BTCUSD price dynamics (Source: TradingView)
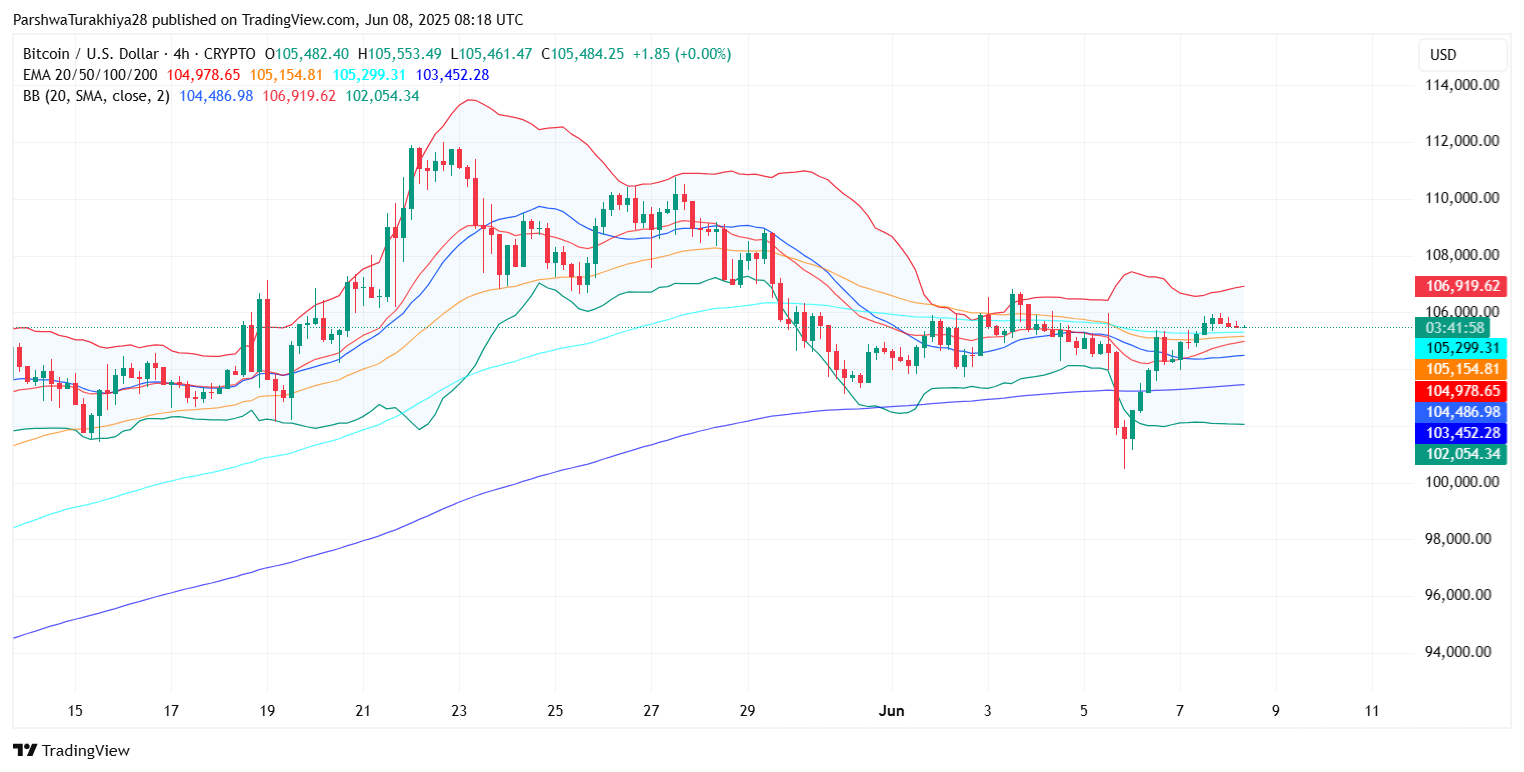
The Bitcoin price action has seen a decisive rebound from the $102,000 region, recovering over 3% in just two sessions. This move followed a bounce from the confluence of dynamic support around the 100-EMA and horizontal demand near $101,000. However, the 4-hour chart shows that price is once again stalling near a significant resistance block between $105,800 and $106,900—an area that coincides with the upper Bollinger Band and previous rejection zones from late May.
The recent Bitcoin price update highlights how tightly the asset is coiled within a short-term symmetrical triangle, with breakout pressure mounting as volatility compresses. This pattern is forming just below key resistance and typically precedes a directional move, either confirming a breakout continuation or indicating a short-term correction.
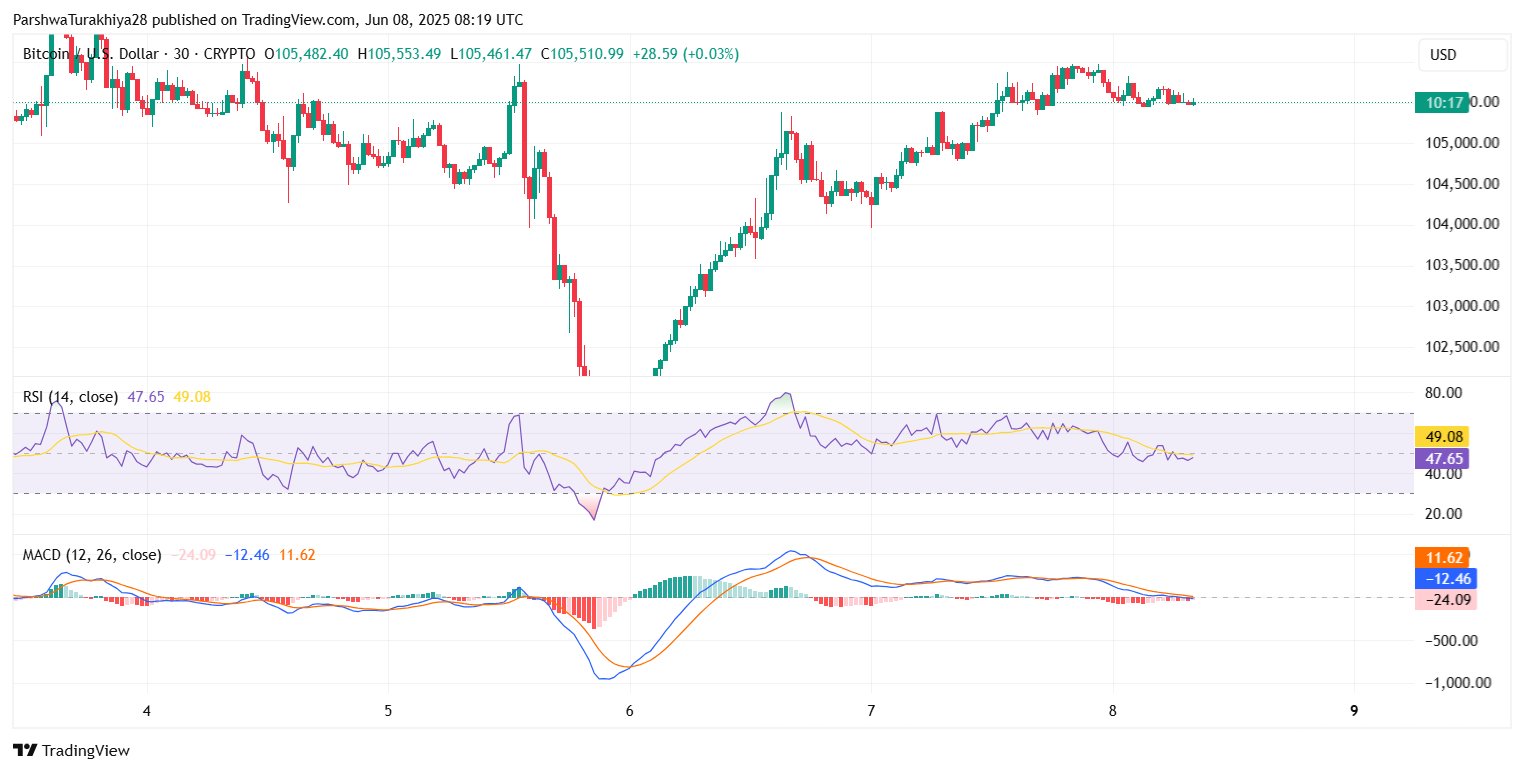
RSI, MACD Suggest Short-Term Caution
BTCUSD price dynamics (Source: TradingView)
Momentum indicators on the 30-minute and 4-hour charts reflect caution despite the rebound. The RSI on the 30-minute chart is currently fluctuating near the neutral 50 zone (47.65), failing to break higher despite multiple intraday attempts. This divergence between price strength and RSI momentum suggests waning bullish pressure at current levels.
The MACD histogram, while positive, is flattening out after a recent bullish crossover. This plateauing indicates that buying interest may be weakening, and bulls need a clear volume push to sustain further gains. Without that, Bitcoin price volatility may increase in both directions over the next 24 to 48 hours.
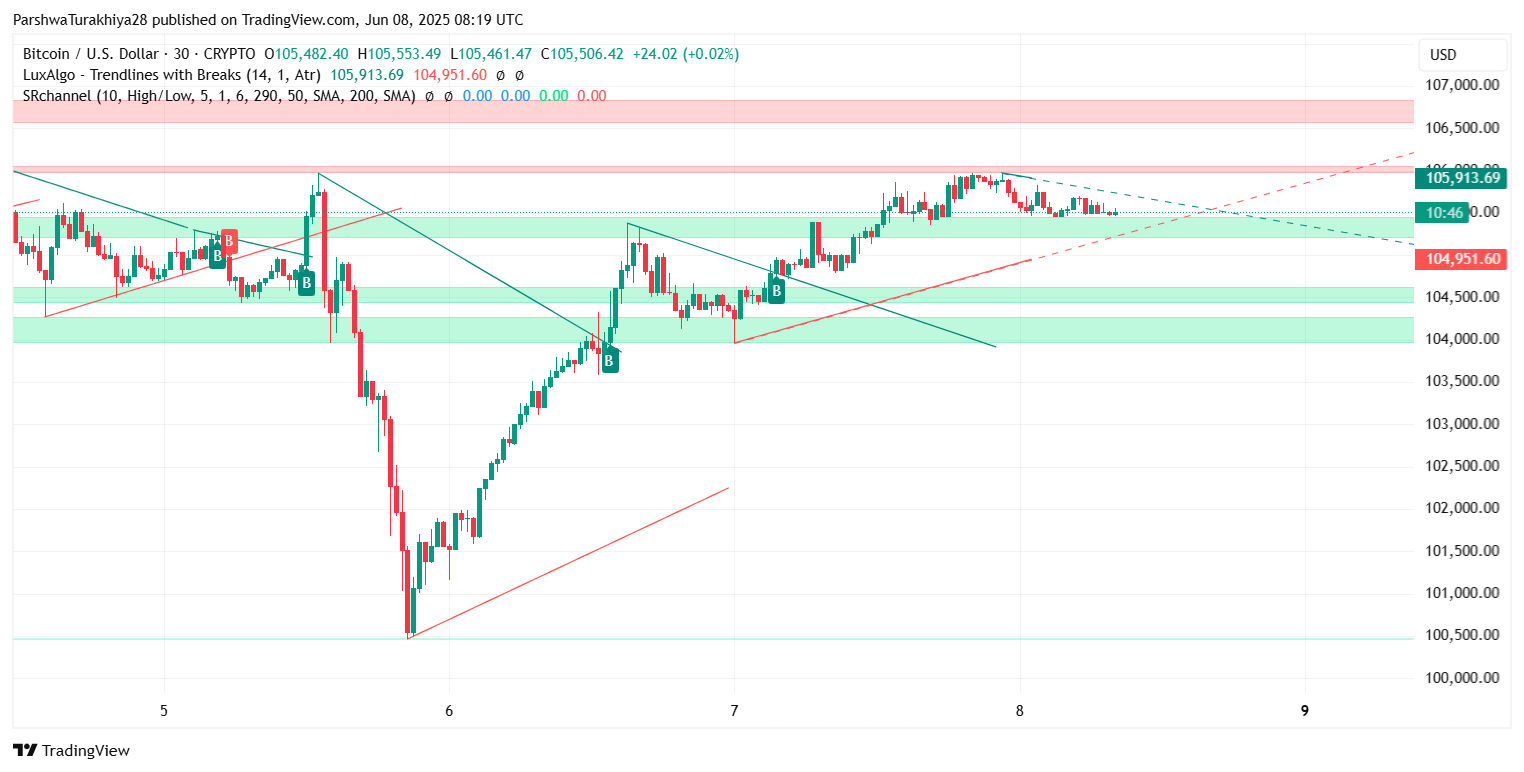
Key EMA Clusters and Ichimoku Analysis
BTCUSD price dynamics (Source: TradingView)
On the 4-hour chart, Bitcoin price is trading above the 20/50/100 EMA cluster, which currently sits between $104,900 and $105,300. This zone acts as intraday dynamic support, and a loss below $104,800 would invalidate the short-term bullish structure.
BTCUSD price dynamics (Source: TradingView)
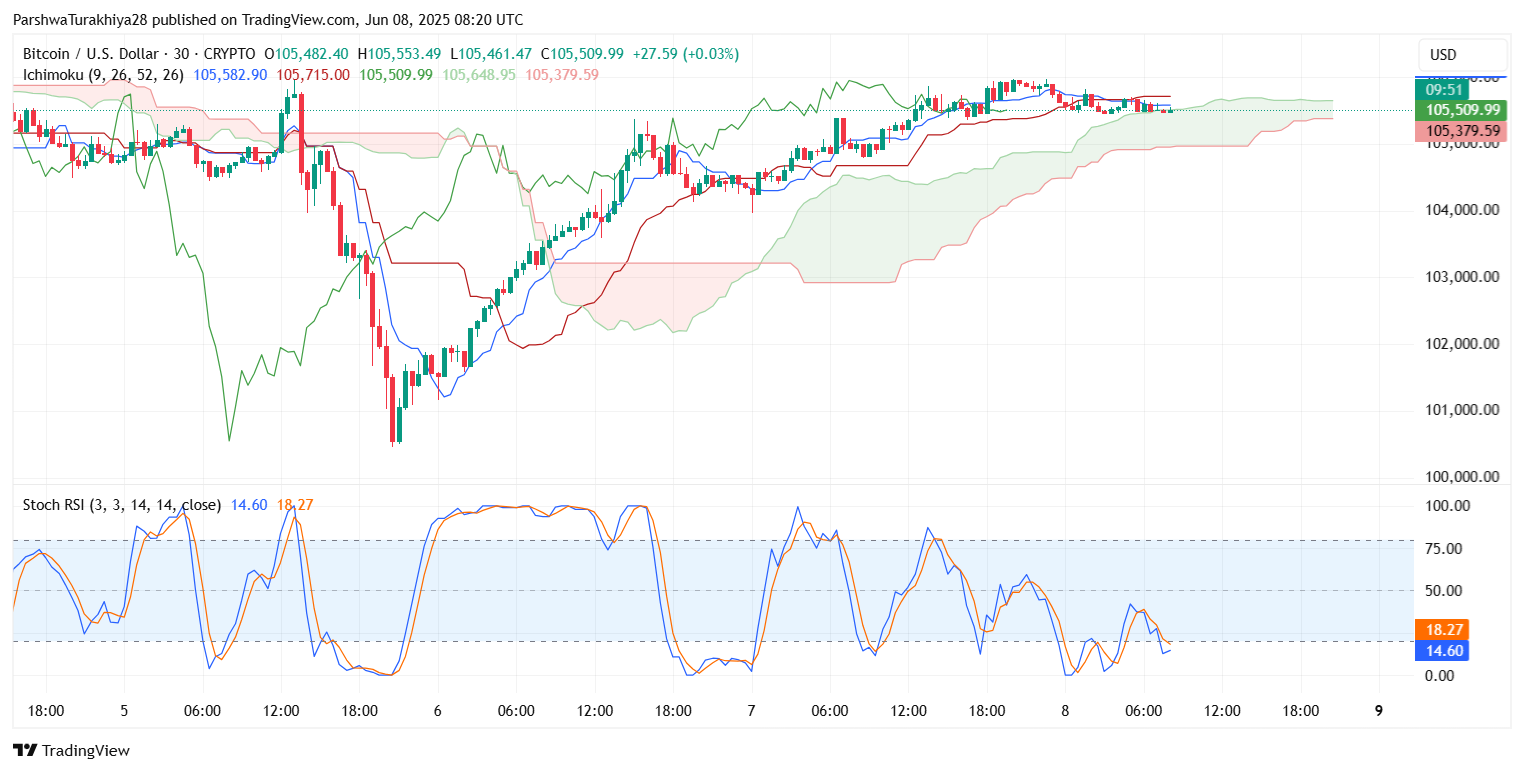
The Ichimoku cloud on the 30-minute chart shows that BTC is trying to stay above the flat Kijun-Sen at $105,400, but the future cloud appears thin and bearish, suggesting vulnerability to minor pullbacks.
Meanwhile, the Bollinger Bands remain tight, reflecting declining Bitcoin price volatility, which often precedes sharp directional moves. A daily close above $106,500 would mark a clean breakout and potentially expose the $108,300–$109,000 region, last tested in late May.
Higher Timeframe Outlook Remains Constructive
BTCUSD price dynamics (Source: TradingView)
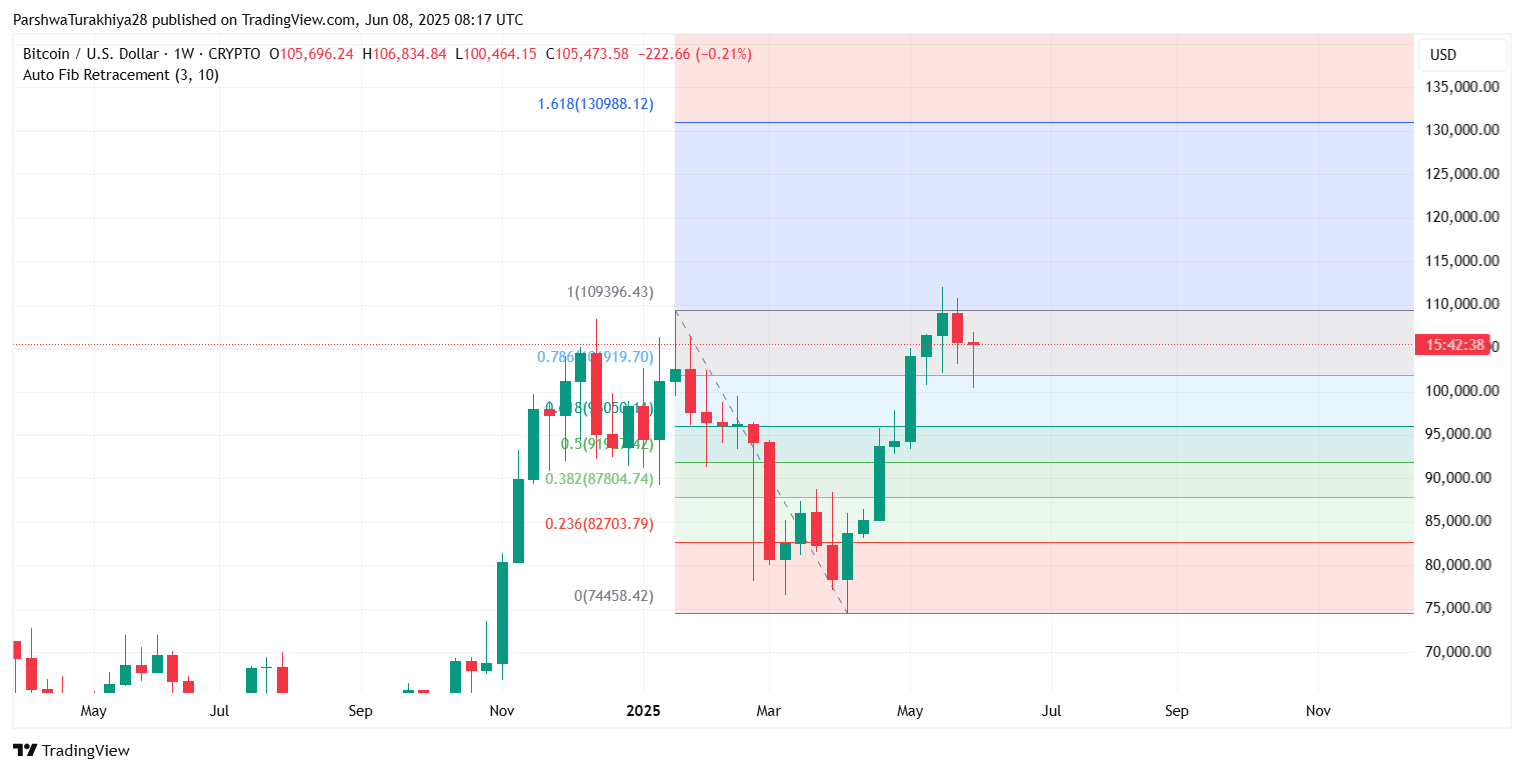
On the weekly timeframe, Bitcoin price is forming a higher low structure after reclaiming the 0.618 Fibonacci retracement level at $100,942. This level held firm during the May correction, and the 0.786 Fib near $104,900 is now acting as mid-term support. Should BTC hold above this Fib level through June 10, the next major upside objective remains the $109,000 high, followed by the extended 1.618 Fib projection at $130,900.
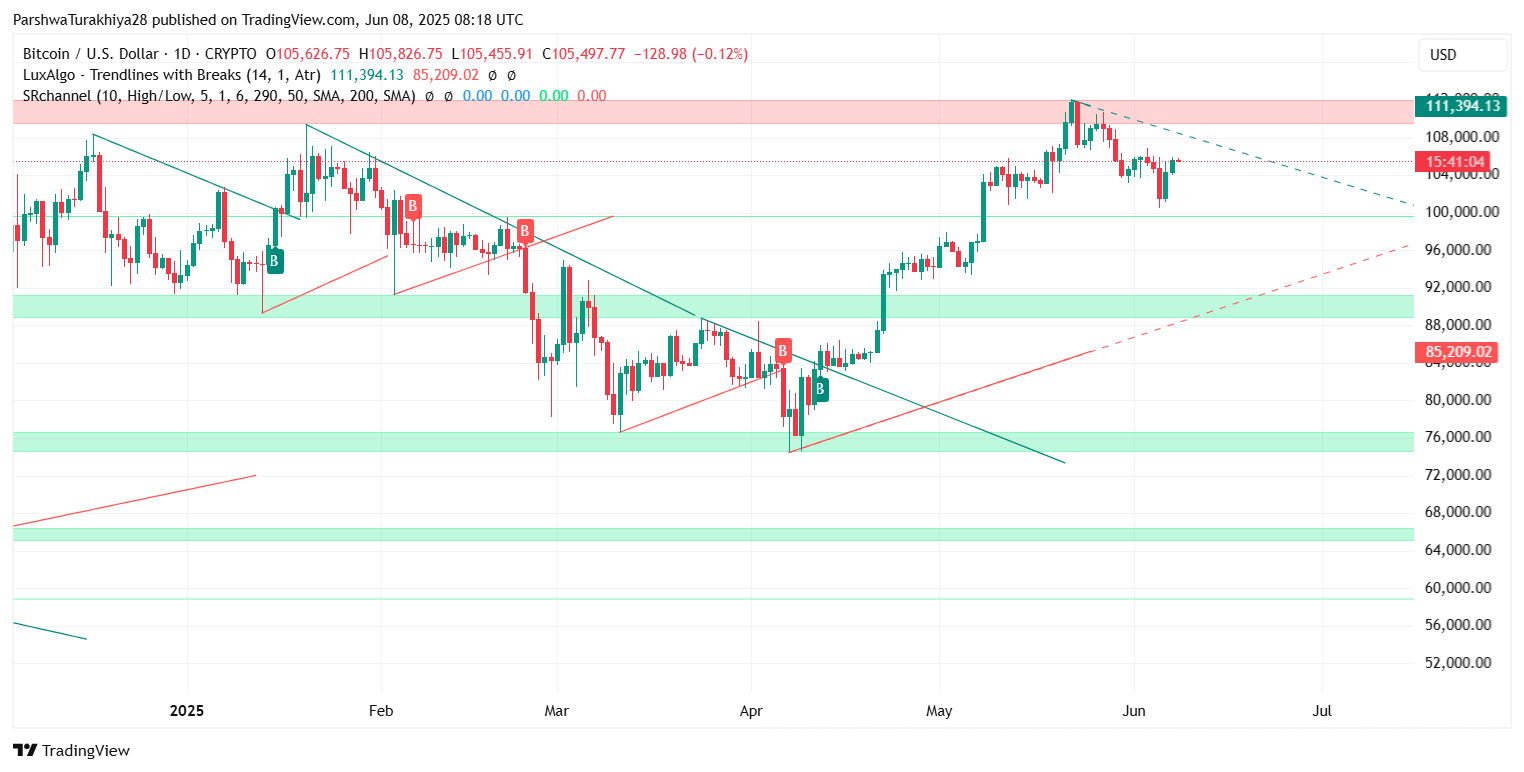
BTCUSD price dynamics (Source: TradingView)
The 1D chart also reinforces this bias, as BTC trades well above the prior downtrend breakout zone. However, there is still a visible supply zone just above $106,800, and price needs to clear this range with conviction to maintain bullish momentum.
Why Bitcoin Price Going Up Today?
BTCUSD price dynamics (Source: TradingView)
The question many traders are asking is: Why Bitcoin price going up today? The answer lies in a combination of factors. First, the recent bounce from EMA support lines and the bullish triangle breakout on the 1-hour chart sparked renewed short-term interest. Second, macro sentiment around inflation cooling in the U.S. and dovish central bank signals has boosted risk appetite across major crypto assets.
Volume spikes around $104,000 also suggest strong institutional bid interest, possibly fueled by ETF-related demand and on-chain wallet accumulation. Still, without confirmation from a breakout above $106,900, the price action remains technically rangebound in the short term.
BTC Forecast Table for June 10
In conclusion, Bitcoin price today shows resilience but also signs of exhaustion below $106,900. A breakout above this zone will be essential for bulls to retest prior highs, while a drop below $104,800 may trigger a short-term correction toward the $102,500 region. Traders should closely monitor the triangle structure and EMA supports as Bitcoin price action moves into a decision zone for the week ahead.
Disclaimer: The information presented in this article is for informational and educational purposes only. The article does not constitute financial advice or advice of any kind. Coin Edition is not responsible for any losses incurred as a result of the utilization of content, products, or services mentioned. Readers are advised to exercise caution before taking any action related to the company.
Read the full article here


