


Bitcoin is trading at $103,891 with a market capitalization of $2.065 trillion. Over the past 24 hours, its trading volume reached $28.02 billion, moving within a narrow intraday range of $102,624 to $106,087.
Bitcoin
On the daily chart, bitcoin has shown a distinct bearish bias following a rejection from the $112,000 level. The formation of a double-top pattern near that high has led to a consistent sequence of lower highs and lower lows, with dominant selling volume reinforcing the downtrend. The current support sits firmly in the $100,000 to $102,000 range, while resistance remains heavy around $108,000 to $110,000. A close below the $100,000 threshold would signal a structural breakdown, though for now, price action suggests cautious consolidation.
BTC/USD 1-day chart via Bitstamp on June 21, 2025.
From the medium-term perspective on the 4-hour chart, bitcoin continues to trace a descending pattern after a rejection near $108,990. It found temporary support at $102,309, a level that has seen several defenses. Price action in this window resembles a bear flag or descending channel, both of which imply a continuation of the existing downtrend. Volume spikes during sell-offs suggest capitulation events or liquidation-based moves. Traders eye potential bounces if the price revisits $102,300–$103,000, though the upside remains capped near $106,000–$107,000 unless volume decisively supports a reversal.

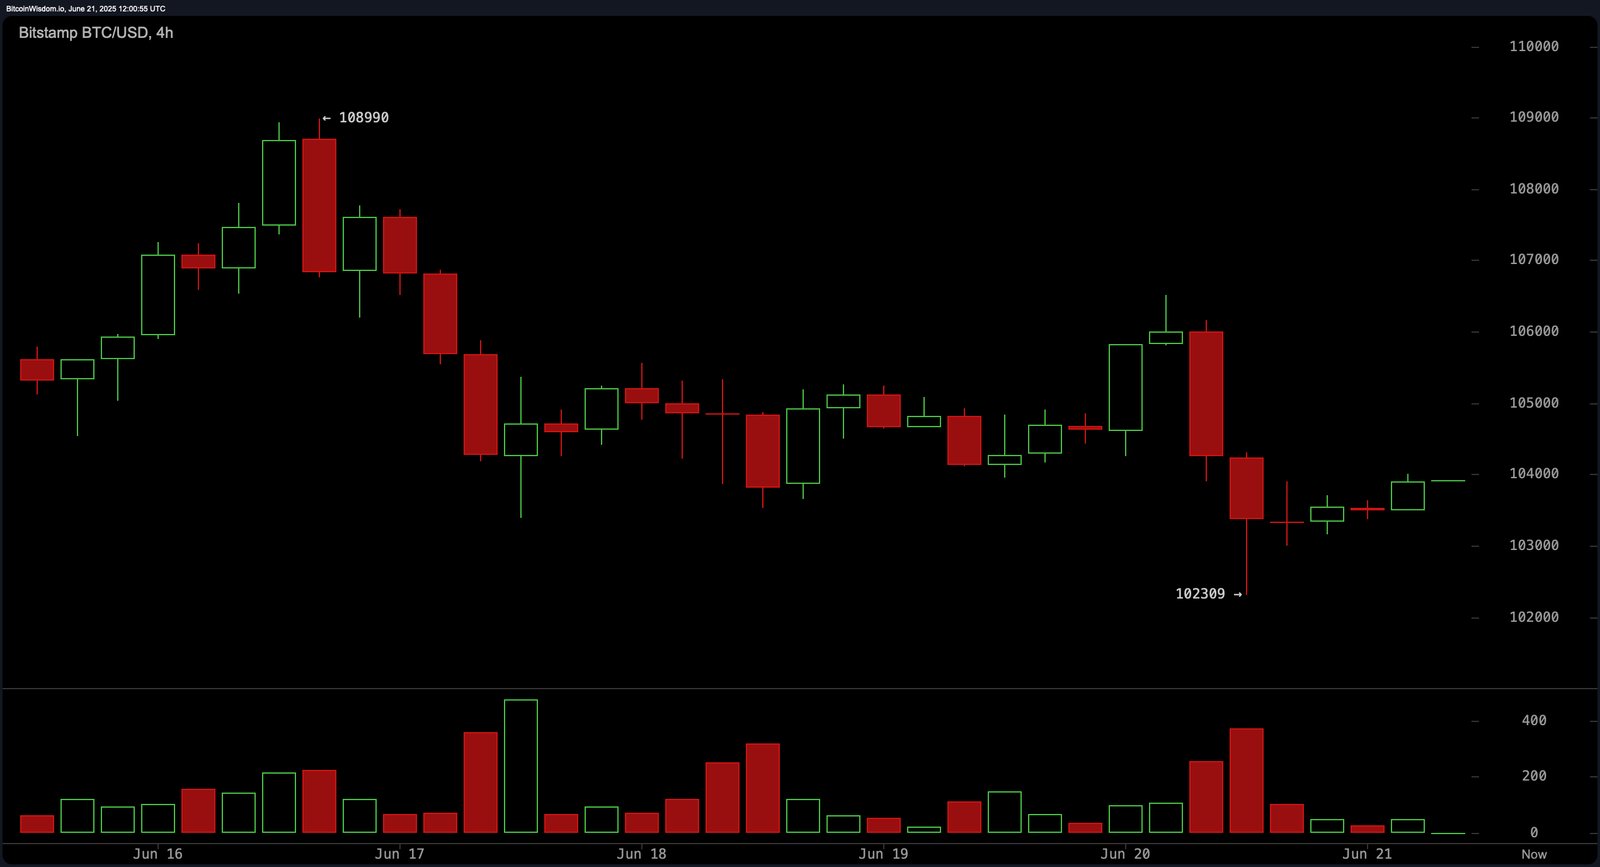
BTC/USD 4-hour chart via Bitstamp on June 21, 2025.
Intraday activity reflected on the 1-hour bitcoin chart points to a stagnant, range-bound session. The local low again touched $102,309, with a high marked at $106,521. Momentum has weakened notably, and the price has been oscillating in a tight range without conviction. With volume tapering off, both bulls and bears appear indecisive at current levels. Scalping opportunities may present themselves between $102,500–$103,000 on dips, targeting exits around $104,000–$105,000. However, any hourly close under $103,000 could tip the scales toward another bearish leg.
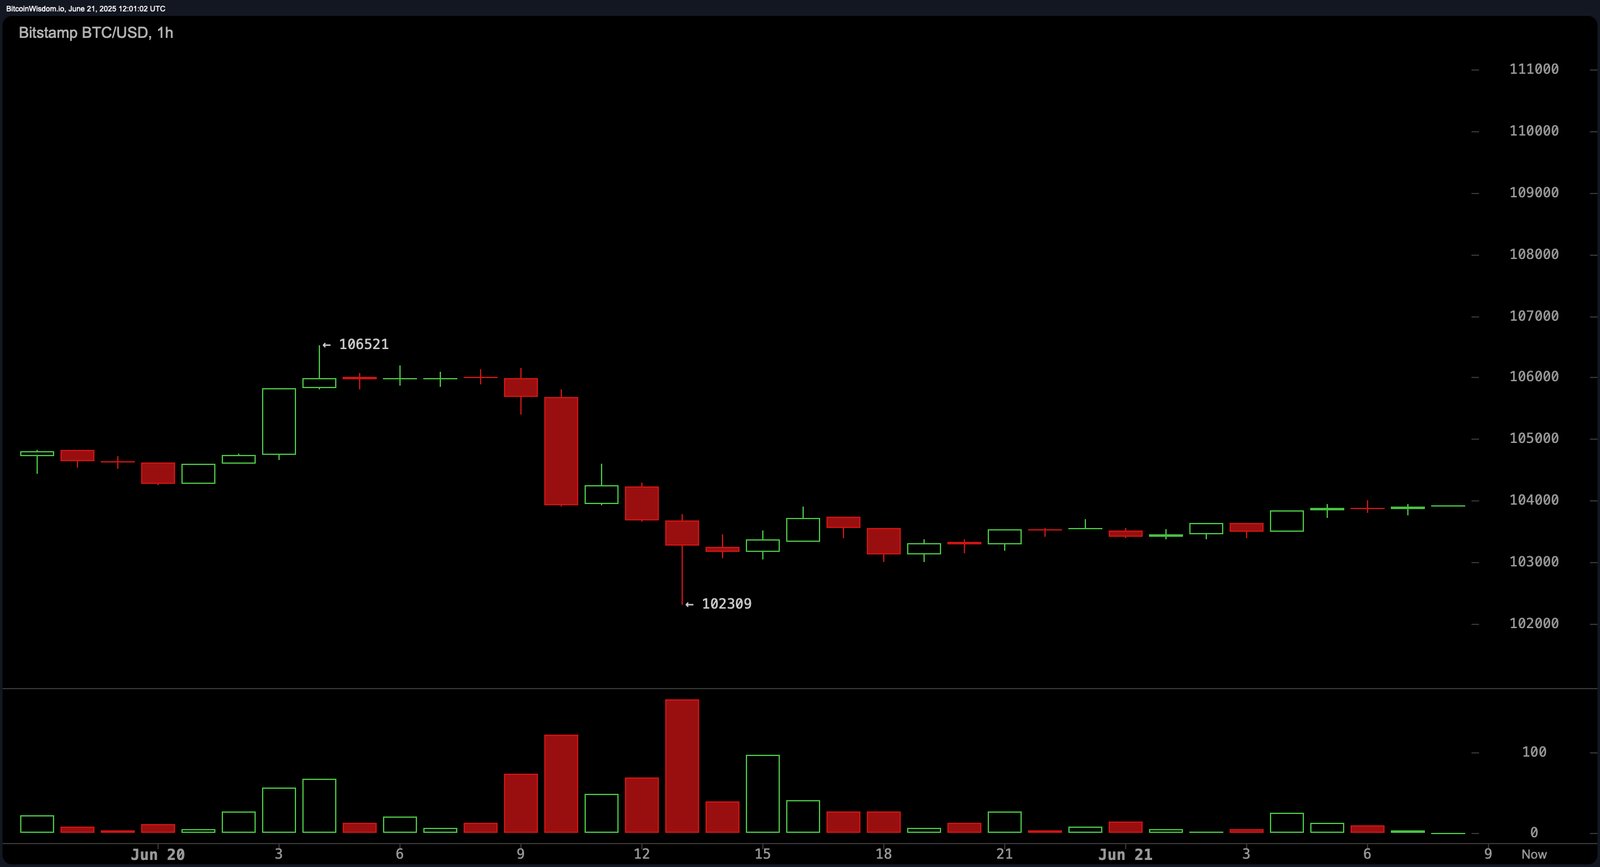
BTC/USD 1-hour chart via Bitstamp on June 21, 2025.
Oscillators convey a mixed outlook. The relative strength index (RSI) stands at 46, suggesting a neutral stance. The Stochastic oscillator reads 23, and the commodity channel index (CCI) is at −97, both also neutral. Meanwhile, the average directional index (ADX) at 16 confirms a lack of strong trend momentum. The awesome oscillator prints −1,774, echoing bearish undertones. Notably, the momentum oscillator reads −4,801, indicating a positive signal, while the moving average convergence divergence (MACD) level is −73, registering a negative signal. This divergence hints at potential volatility with conflicting directional cues.
Moving averages (MAs) on the whole support a bearish outlook. Short-term indicators including the 10-day and 20-day exponential moving averages (EMA) and simple moving averages (SMA) all flash bearish signals, aligning with the broader downtrend. However, longer-term indicators such as the 50-day, 100-day, and 200-day exponential moving averages and simple moving averages lean bullish, with most signaling positivity. This divergence underscores the market’s transitional phase, where near-term weakness exists within a larger framework of longer-term strength.
Bull Verdict:
For bullish momentum to regain control, bitcoin must reclaim and sustain levels above $106,000 with convincing volume and structure. Until then, long positions remain speculative, and any upside is likely corrective within a broader consolidation zone.
Bear Verdict:
If bitcoin closes below the $102,000 mark on strong volume, a deeper correction becomes increasingly probable. With short-term moving averages aligned against the price and oscillators showing minimal strength, bearish continuation remains the path of least resistance.
Read the full article here

 Price Prediction for June 21")

