Bitcoin’s price on Dec. 15, 2024, has hit a cool $102,513, just a whisker away — 1.2% — from its record-breaking peak of $103,647. The cryptocurrency is on a generally optimistic path, bolstered by solid technical signs and price movements across various charts.
Bitcoin
On the hourly chart, bitcoin is climbing nicely, having recently hung out around $100,600 before bursting through to $102,500. Support is chilling between $101,500 and $101,700, while the resistance is playing hard to get at $103,000 to $103,300, right near the latest peak.
BTC/USD 1H chart on Sunday, Dec. 15.
Indicators are keeping us on our toes: The relative strength index (RSI) at 65 is playing it cool, neutral, while the momentum oscillator is giving a thumbs up with a buy signal at 5,518. However, the moving average convergence divergence (MACD) at 3,347 is waving a little caution flag, hinting at possible retreats.
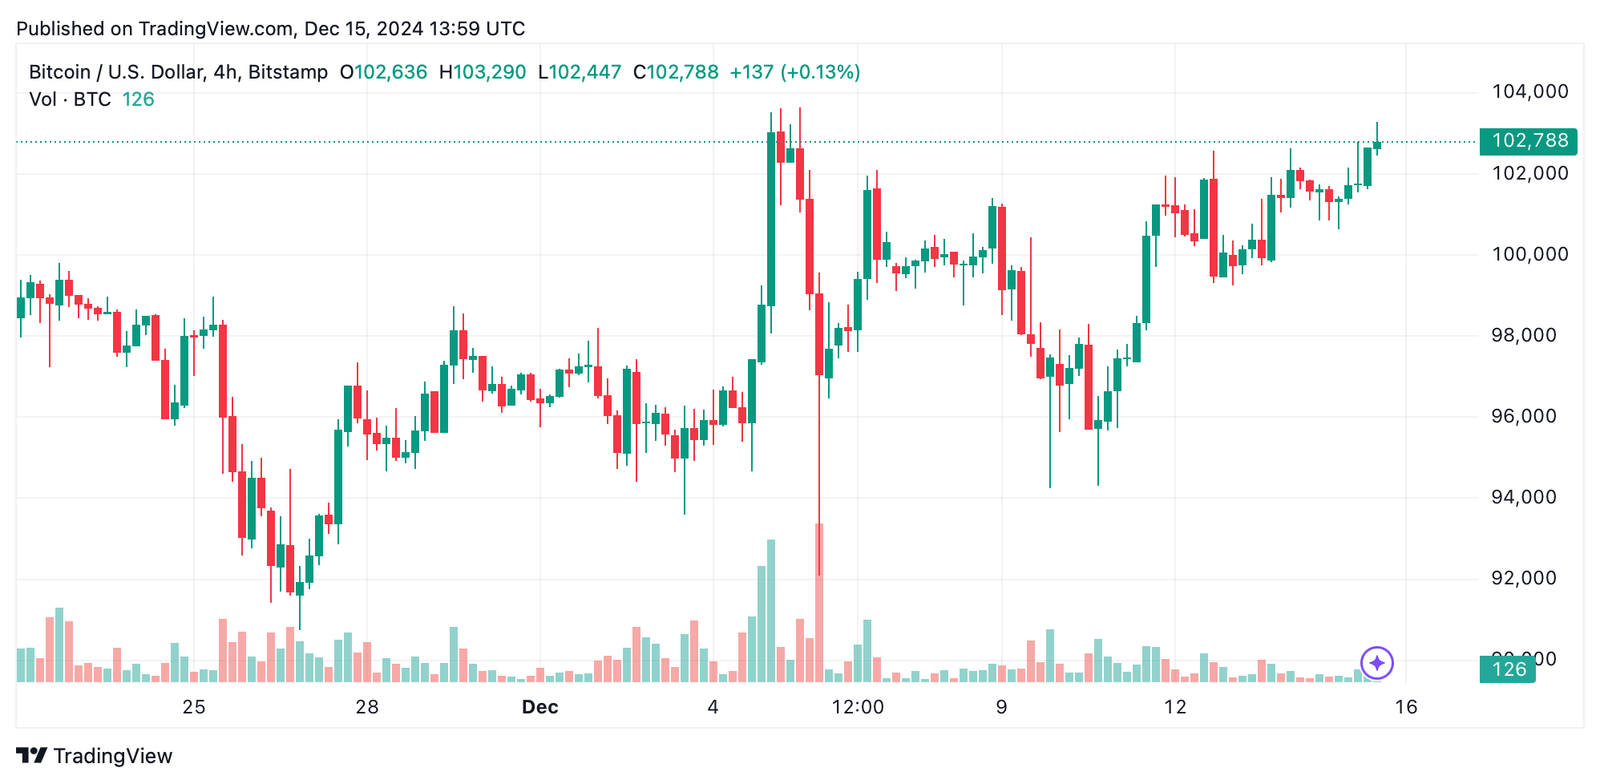
Switch to the 4-hour chart, and you’ll see bitcoin strutting a clear upward path, bouncing back from a low near $94,249 with higher lows. Staying above the big round number of $100,000 screams bullish vibes.

BTC/USD 4H chart on Sunday, Dec. 15.
Support zones are hanging tough from $99,500 to $100,500, and resistance is playing gatekeeper at $103,500 to $104,000. Volume patterns show folks are eager to buy, but watch out for selling pressures at the top that might cause some hiccups.
The daily chart tells a tale of bitcoin’s bounce-back from a low of $80,280 to where it’s dancing now. Those green candles are popping, and the volume’s up, signaling big players are in the game, especially as it crossed $100,000.
BTC/USD Daily chart on Sunday, Dec. 15.
Support is firm between $98,000 and $100,000, setting the stage for more upward fun. Resistance at $103,500 to $105,000 could be the next big hurdle; smashing through might just lead to new highs. Look for entry points around the 20-day simple moving average ($98,212) or at that magical $100,000, with sights set on profits in the $104,000-$105,000 zone.
Across all these timeframes, moving averages are giving a strong positive nod, with both exponential moving averages (EMAs) and simple moving averages (SMAs) from 10 to 200 days cheering on the ascent. Oscillators like the Stochastic at 84 and the average directional index (ADX) at 40 are keeping things balanced, while the awesome oscillator at 5,050 is all aboard the bullish train.
But traders should keep an eye on that MACD — its bearish signals on both the hourly and 4-hour charts hint at some short-term roller-coaster moments ahead.
Bull Verdict:
Bitcoin’s upward momentum across all major timeframes, supported by strong moving averages and sustained buying volume, paints a robust bullish picture. The cryptocurrency appears poised to challenge its all-time high of $103,647 and potentially push beyond the $105,000 resistance if volume persists. Traders should remain optimistic, targeting further gains while managing risk at key support levels around $100,000.
Bear Verdict:
Despite bitcoin’s strong recovery, bearish signals from the MACD and resistance near $103,500-$105,000 suggest potential exhaustion. Sellers at these levels could induce a pullback, with prices revisiting the $98,000-$100,000 range. A failure to hold this support could lead to a deeper correction, turning the short-term outlook cautious for traders.
Read the full article here
