


Bitcoin currently hovers near $86,668, boasting a $1.71 trillion valuation and $69.5 billion in daily transactional activity, fluctuating between $84,971 and $90,940. Technical patterns across varied intervals tilt decisively toward caution, painting a somber portrait for near-term prospects.
Bitcoin
Bitcoin‘s daily timeframe reveals persistent liquidation pressures after a swift retreat from the $106,000 pinnacle triggered a cascading drop. A fleeting stabilization at $78,197 now anchors interim stability, though the $94,000 ceiling stifles recovery efforts. Pronounced bearish formations, amplified by vigorous transactional flows, fortify pessimistic expectations, with $82,000 emerging as a plausible floor should downward forces intensify.
BTC/USD 1D chart via Bitstamp on March 7, 2025.
While shorter-term metrics—such as the exponential moving average (EMA 10) at $88,933 and simple moving average (SMA 10) at $87,407—flash warnings of frailty, the enduring exponential moving average (EMA 200) at $85,831 and simple moving average (SMA 200) at $83,037 whisper of latent demand.
Zooming to the four-hour window, bitcoin’s swift downturn from $95,152 illustrates faltering vitality above $90,000. Escalating sell-side participation cements the descent, while the exponential moving average (EMA 10) and simple moving average (SMA 10) linger beneath current valuations, echoing bearish rhythms.

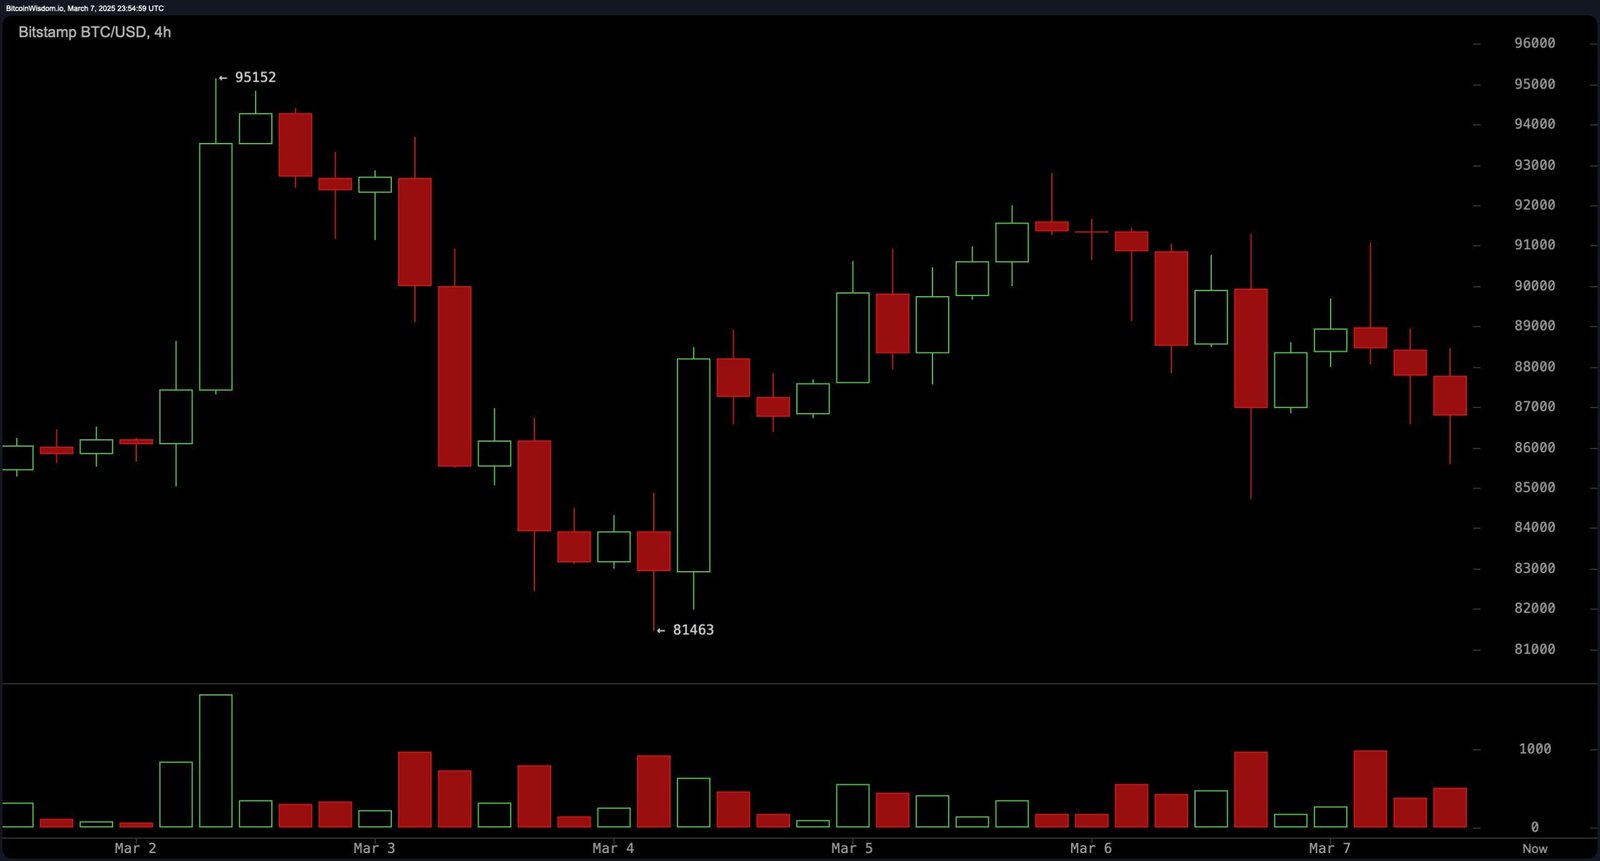
BTC/USD 4H chart via Bitstamp on March 7, 2025.
An unsuccessful rally above $91,000 solidifies this zone as a formidable barrier, positioning short-term bearish strategies as prudent if prices falter between $88,000 and $90,000, eyeing $85,000 or $82,000 as destinations.
The hourly lens echoes immediate liquidation patterns, with repeated denials near $91,560 propelling valuations to $84,713. Subdued transactional activity hints at waning conviction, yet directional momentum leans downward.
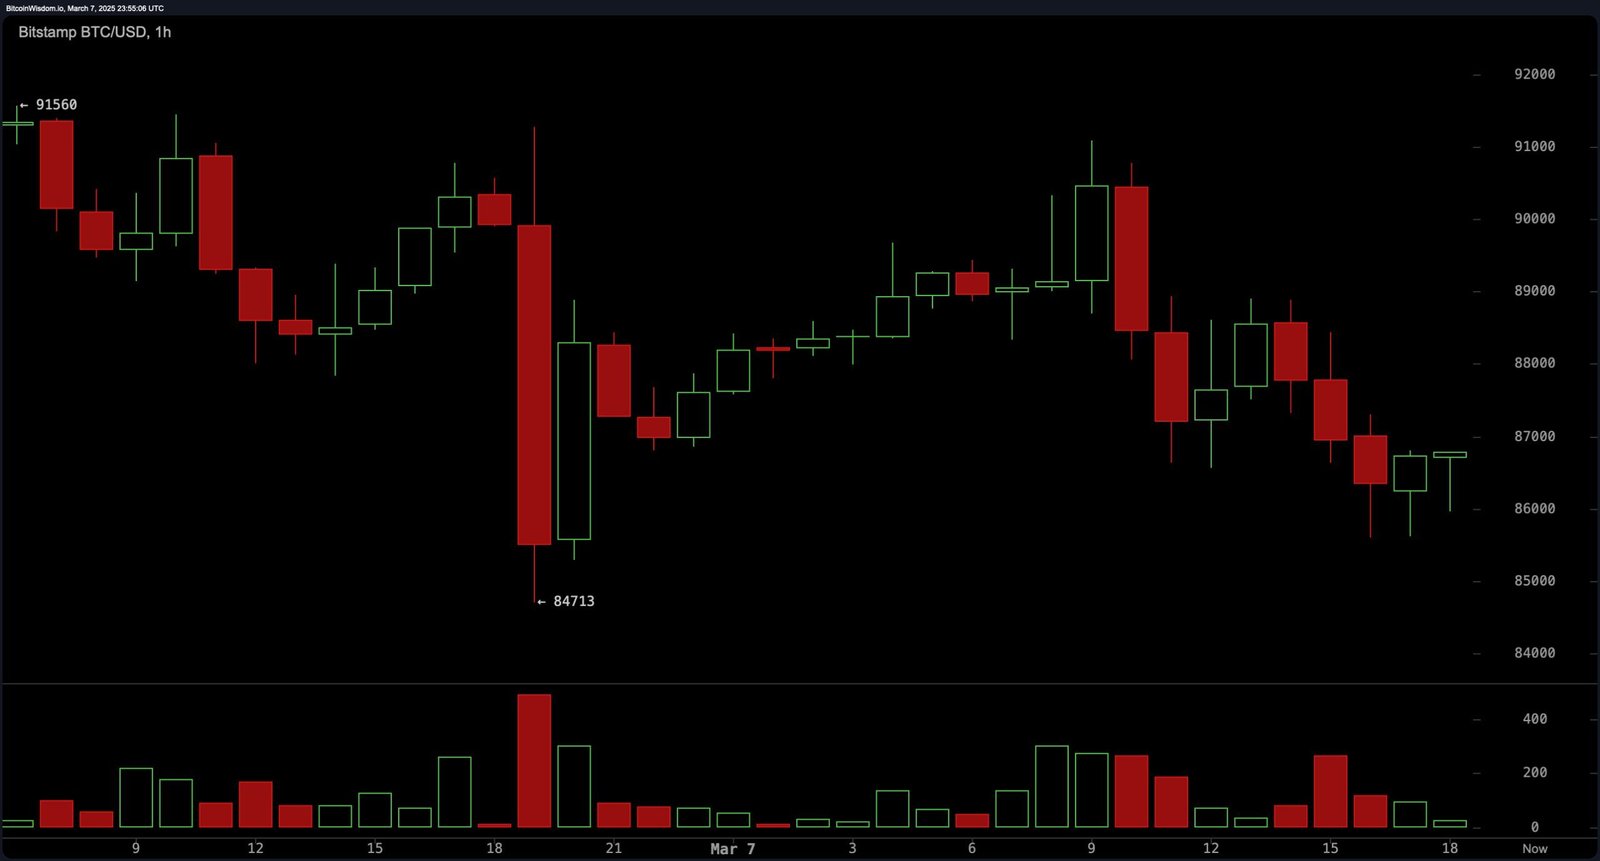
BTC/USD 1H chart via Bitstamp on March 7, 2025.
Neutral readings from the relative strength index (RSI) at 42 contrast with the awesome oscillator (AO) and momentum gauges, which tilt toward distribution. Failure to conquer $88,500 may invite retreats toward $86,000 or below, though a spirited push past $87,000 with heightened participation could spark ephemeral rallies toward $89,000 or $90,000.
Momentum metrics and trend-following tools collectively reinforce cautionary narratives. The commodity channel index (CCI) at -55 sits idle, while the awesome oscillator (AO) and momentum readings tilt toward pessimism.
Every short- to medium-term trend tracker—from the exponential moving average (EMA 10) to the simple moving average (SMA 100)—broadcasts sell directives. Only the distant simple moving average (SMA 200) at $83,000 offers a glimmer of foundational support.
With bitcoin (BTC) ensnared beneath gravitational resistance, near-term risks skew downward. Foundational tiers at $85,000, $82,000, and $78,000 may face scrutiny before equilibrium resurfaces. Absent a decisive thrust above $91,000, the path of least resistance slopes southward, inviting tests of deeper thresholds in sessions ahead.
Bull Verdict:
Despite short-term bearish momentum, long-term support near $83,000 and $85,000 could provide a solid foundation for a rebound if buyers step in. A breakout above $91,000 may signal renewed upside potential.
Bear Verdict:
Bitcoin remains in a clear downtrend, with strong resistance at $90,000 and key indicators favoring further downside. If selling pressure persists, BTC could test lower support levels near $82,000 and $78,000 before any significant recovery.
Read the full article here


