


 Price Prediction For June 21 2025")
The Ethereum price today is trading around $2,528, reflecting a mild intraday uptick after consolidating for much of the past week. However, bulls remain cautious as ETH continues to trade within a tightening range, pressured by resistance at the $2,580–$2,600 zone and supported near $2,500. This period of low Ethereum price volatility suggests that a breakout may be nearing as momentum builds around the June 21 options expiry.
Why is the Ethereum Price Going Up Today?
ETH spot inflow/outflow data (Source: Coinglass)
Over the last 48 hours, Ethereum has seen net outflows of over $82 million across spot exchanges, according to CoinGlass data. This sustained negative netflow is typically viewed as a sign of long-term accumulation, with whales and institutions moving assets into cold storage or self-custody. Although price has not exploded upward yet, these outflows help explain why Ethereum price going up today, at least marginally, as supply on exchanges tightens.
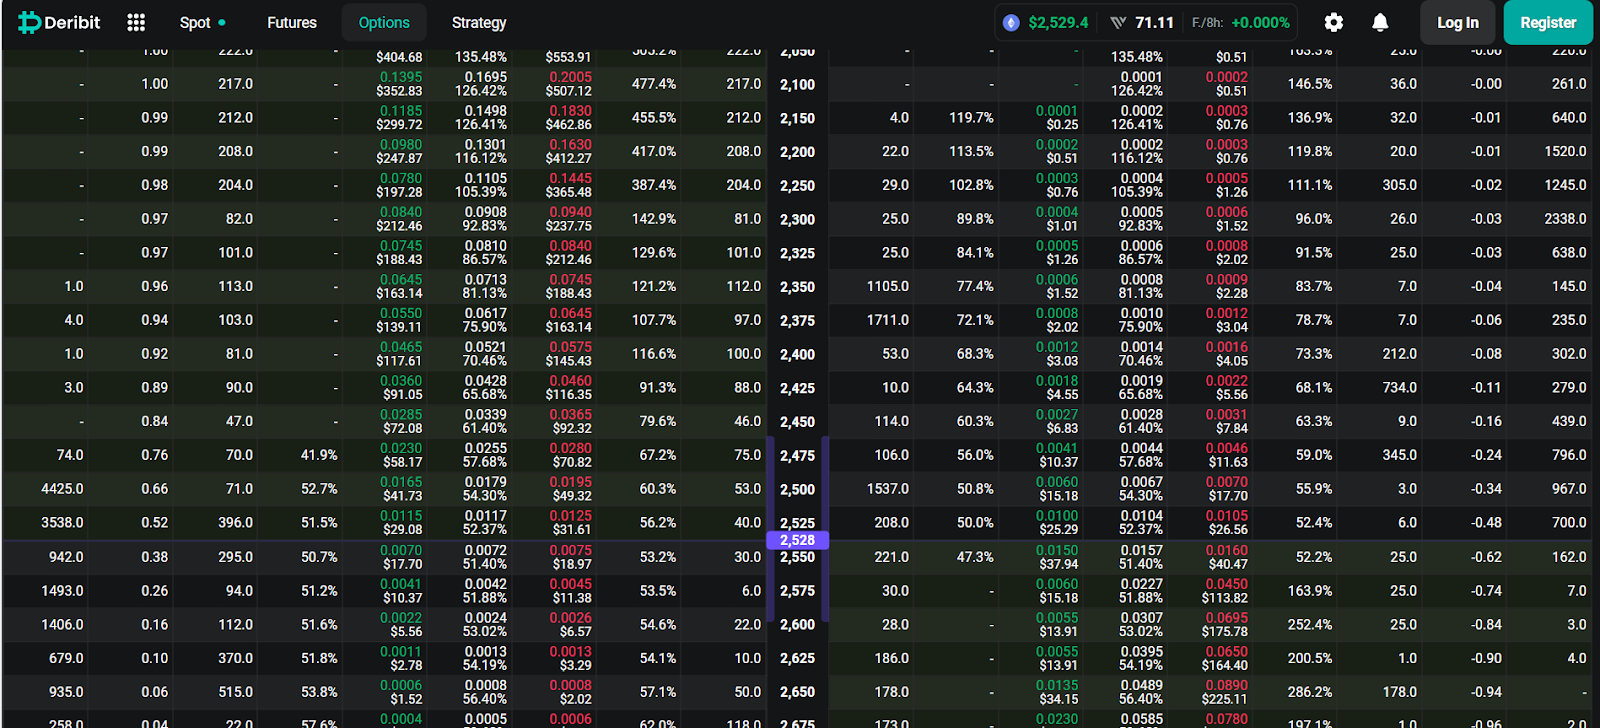
ETH option chain data (Source: Deribit)
This on-chain trend is further supported by derivatives data. The June 21 options chain shows heavy open interest concentrated at the $2,500 and $2,600 strike levels, indicating that a large number of traders are positioned for a potential move within or beyond this range. If bulls can hold ETH above $2,500 ahead of expiry, it may force short-covering or delta hedging activity that lifts price through key resistance.
What’s Happening With Ethereum’s Price?
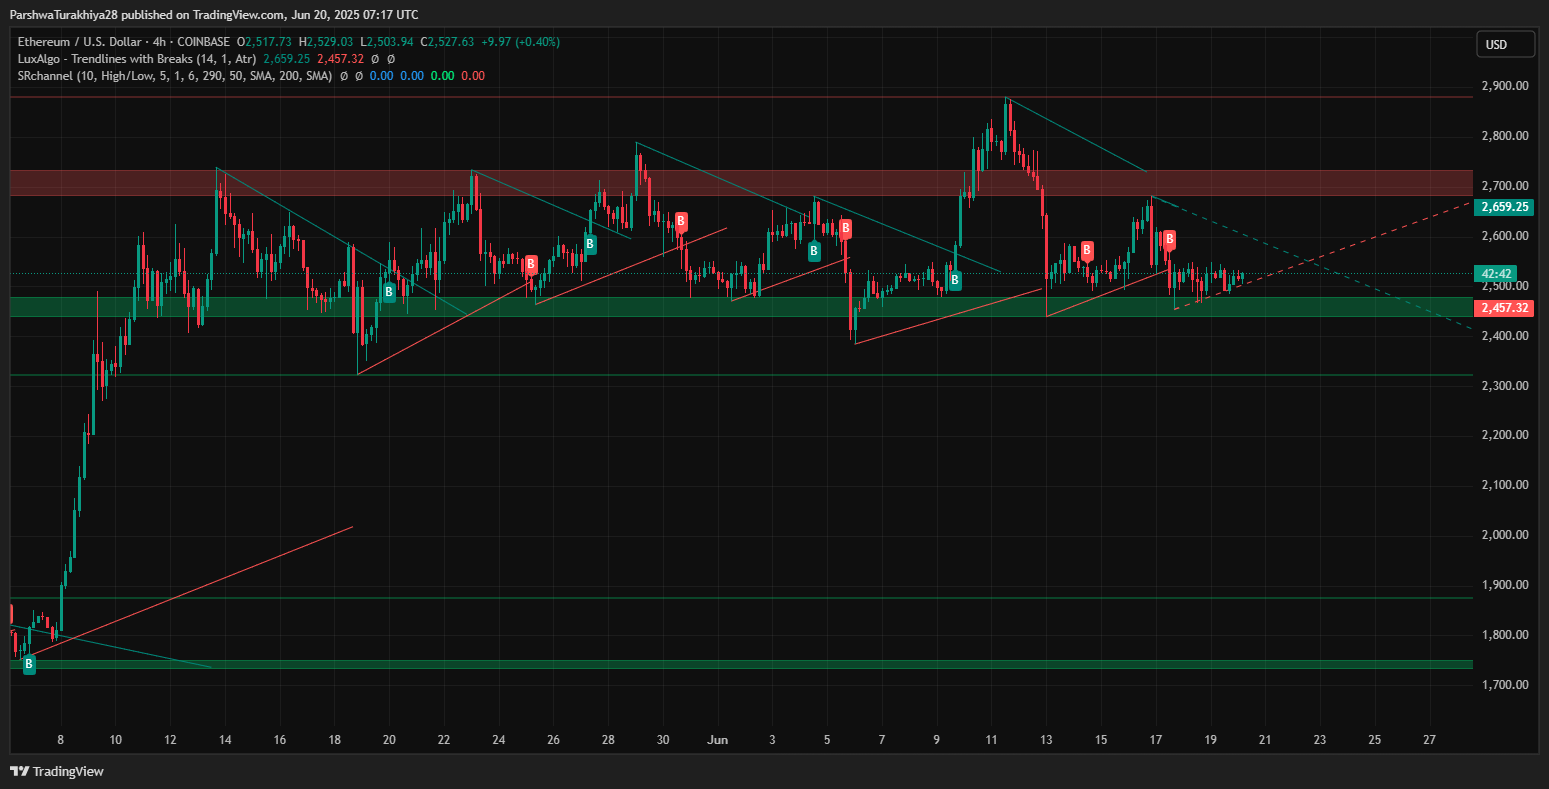
ETH price forecast (Source: TradingView)
The Ethereum price action on the 4-hour chart shows a clear compression pattern forming between rising support near $2,457 and descending resistance at $2,659. ETH remains locked inside this narrowing wedge after multiple failed breakout attempts in the past week. This tight structure often precedes a volatility spike, and current levels suggest the market is on the verge of a directional move.
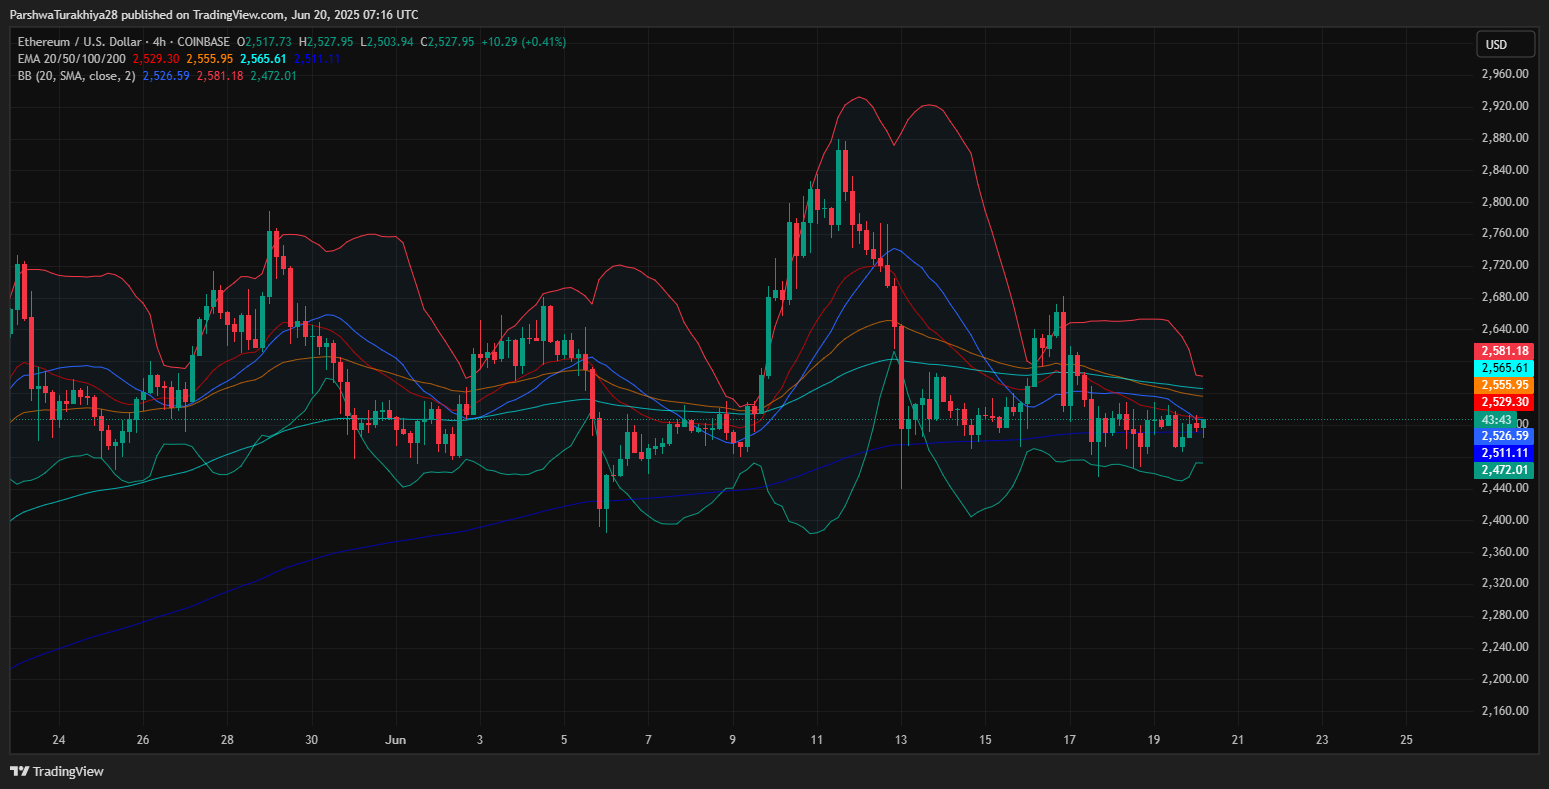
ETH price forecast (Source: TradingView)
On the 4-hour chart, Ethereum remains locked within a tightening channel structure, with multiple lower highs pointing to latent bearish pressure. The Bollinger Bands are contracting, indicating a period of suppressed Ethereum price volatility, often preceding a breakout. The midline of the Bollinger Bands sits at $2,526, right in line with current price action — suggesting the market is undecided.
The EMA cluster (20/50/100/200) between $2,504 and $2,565 continues to act as dynamic resistance. Until Ethereum price can post strong closes above $2,580, upside momentum remains capped.
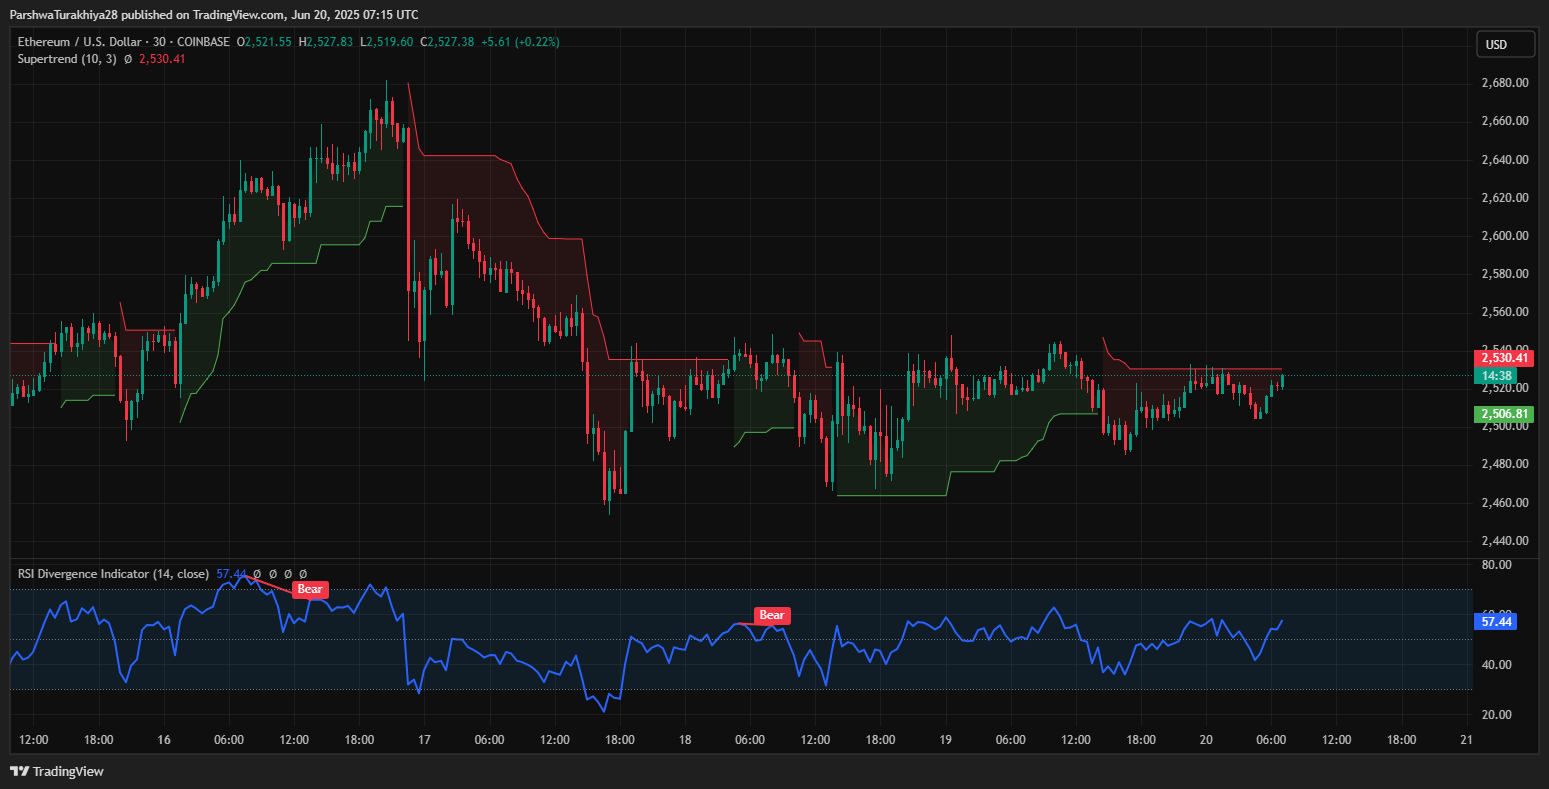
ETH price forecast (Source: TradingView)
The RSI on the 30-minute chart shows a modest recovery to 57.44, but previous bearish divergence on June 17 still lingers in the background. Moreover, the supertrend on the 30-minute chart has just flipped red again at $2,530, indicating lingering selling pressure in the near term.
Ethereum Price Update as Volatility Nears Inflection Point
ETH price forecast (Source: TradingView)
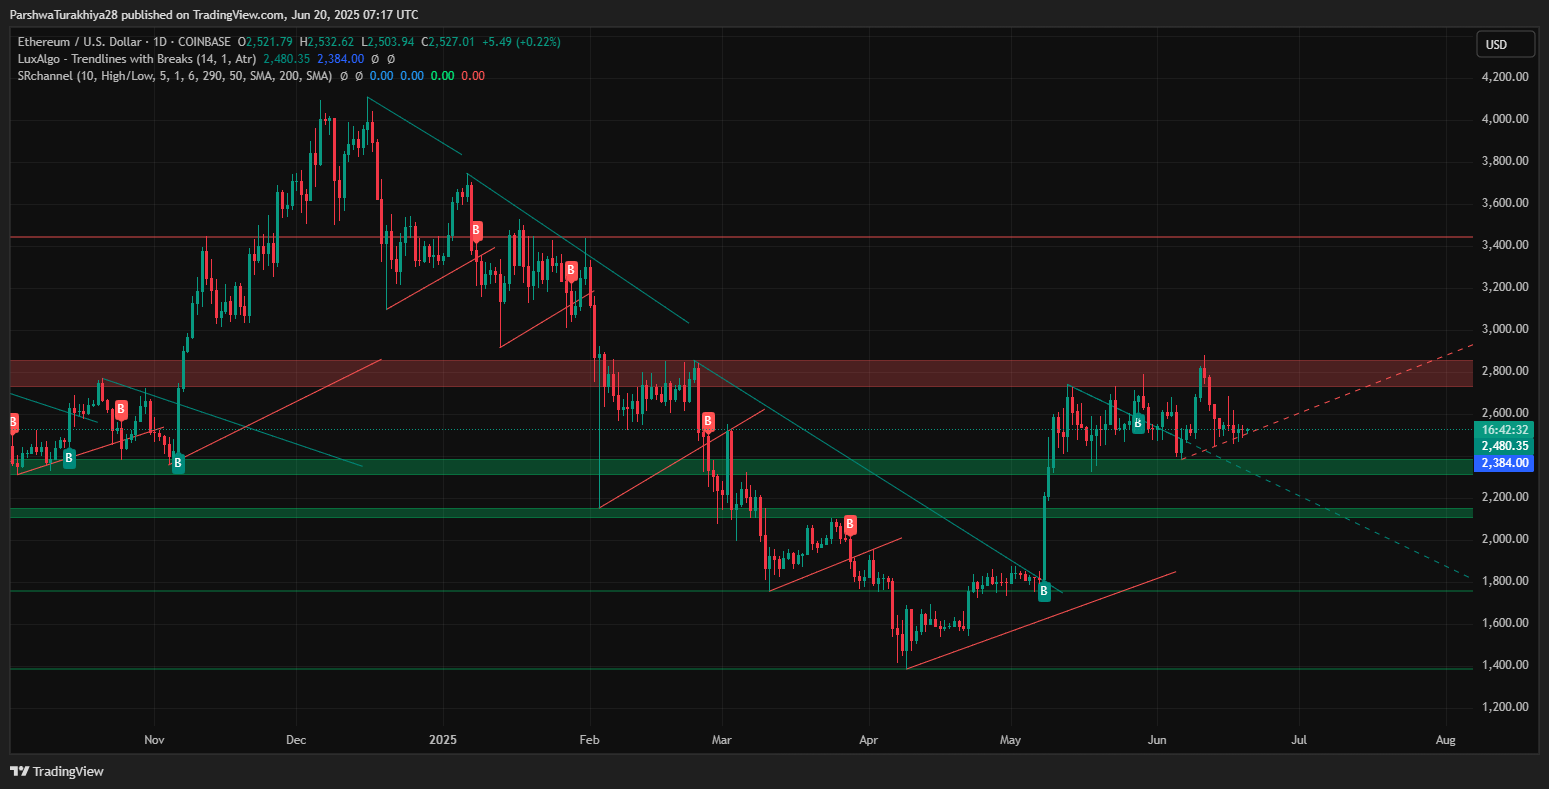
The Ethereum price update across timeframes indicates a coiling structure. On the daily chart, ETH remains range-bound but structurally bullish, holding well above the key support area between $2,384 and $2,457. As long as this zone holds, the medium-term bullish outlook remains intact, especially given the rising low structure seen since late April.
ETH price forecast (Source: TradingView)
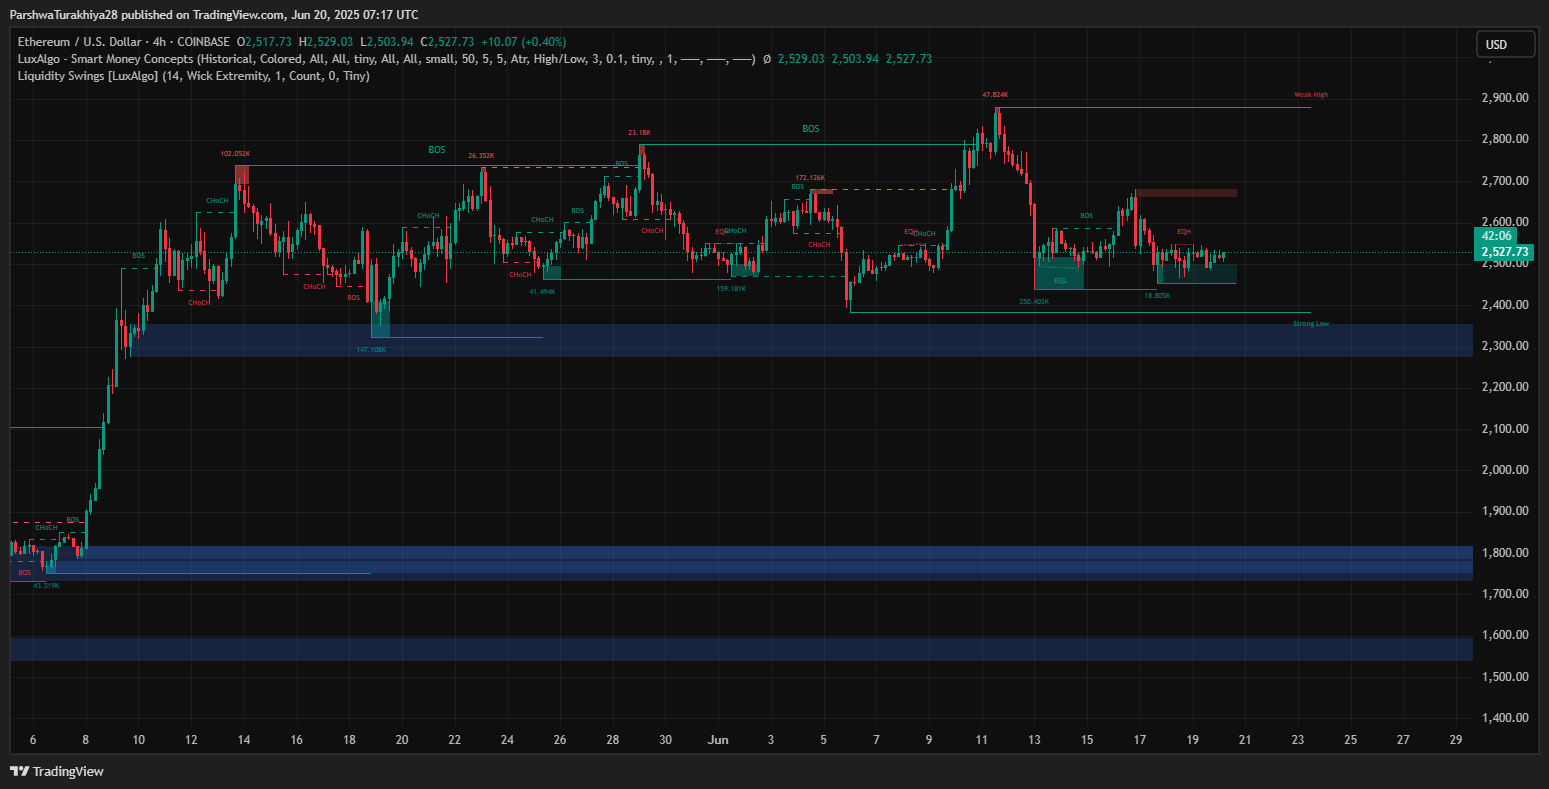
From a smart money perspective, the 4-hour chart displays repeated Change of Character (CHoCH) and Break of Structure (BOS) patterns, but no major liquidity grab has taken place to fuel a breakout. Volume is clustering around the $2,520–$2,530 zone, confirming it as the control point. Without a decisive shift in liquidity above this band, Ethereum price may continue its sideways consolidation into expiry.
ETH price forecast (Source: TradingView)
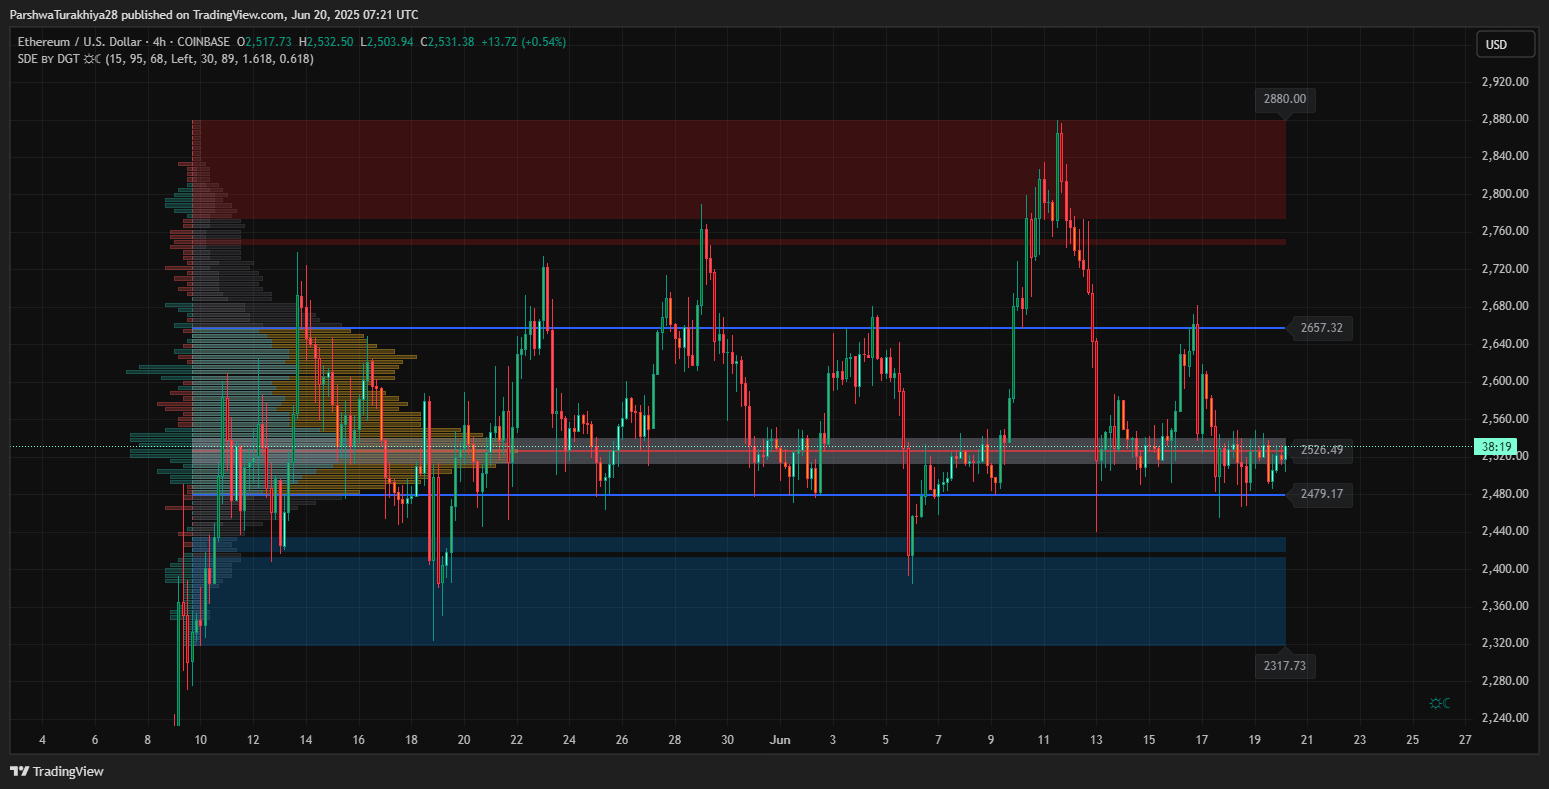
Volume Profile analysis also reveals a major liquidity node between $2,500 and $2,530, which has acted as a pivot zone for several weeks. This cluster of high volume reinforces its role as a critical battleground. A decisive close above this band could open the path to the next major resistance zone at $2,700–$2,750.
Short-Term Ethereum Price Forecast and Key Levels
In the immediate term, traders should keep an eye on the $2,457 support and $2,580 resistance levels. If ETH closes above $2,580 with volume, the next upside target sits at $2,657, with $2,700 and $2,750 following closely. On the downside, failure to hold $2,457 could expose ETH to deeper retracements toward $2,384 or even the $2,237 support from the weekly bull market band.
With consistent spot outflows, options expiry pressure, and a tightly wound technical setup, Ethereum price appears poised for a potential breakout. While short-term direction hinges on reclaiming resistance zones, the broader structure remains constructive. Traders should watch for volume confirmation and breakout momentum near $2,580 to gauge whether Ethereum price spikes are on the horizon—or if further consolidation lies ahead.
Disclaimer: The information presented in this article is for informational and educational purposes only. The article does not constitute financial advice or advice of any kind. Coin Edition is not responsible for any losses incurred as a result of the utilization of content, products, or services mentioned. Readers are advised to exercise caution before taking any action related to the company.
Read the full article here


 Golden Cross Just Received Another Confirmation")
