


Ethereum price is exhibiting downward movement following its breakout from a parallel channel pattern.
According to technical analysts, key support levels failing to maintain their position might trigger the price to approach the $1,250 point
Ethereum Price Breaks Out of Parallel Channel
Crypto analyst Ali Martinez observed that the ETH underwent a major breakout from a parallel channel which normally indicates continuing bearish market trends.
Ethereum experienced further price declines when it broke its critical support points.
The forecasted target lays at $1,250 and shows an estimated 35% reduction from the current price of $1,900.
Ethereum Price Chart Source: X
Consequently, the parallel channel breakout confirms the existing price movement will continue until a major shift occurs in market dynamics.
The technical indicator shows ETH facing a bearish trend which will maintain its downward movement if it does not stay above $1,840 and $1,640 support levels and it is expected to reach $1,250 soon.
MACD and BBP Indicators Show Bearish Momentum
On the technical indicators, Ethereum price shows strong bearish market trends as both MACD and BBP exhibit conditions that point toward increased selling pressure.
The MACD shows bearish conditions because it maintains a position beneath its signal line in the negative zone.
This positioning indicates that the market sentiment is more inclined toward selling than buying.
Strong downward momentum dominates the market according to the MACD histogram which appears in the deep red section.
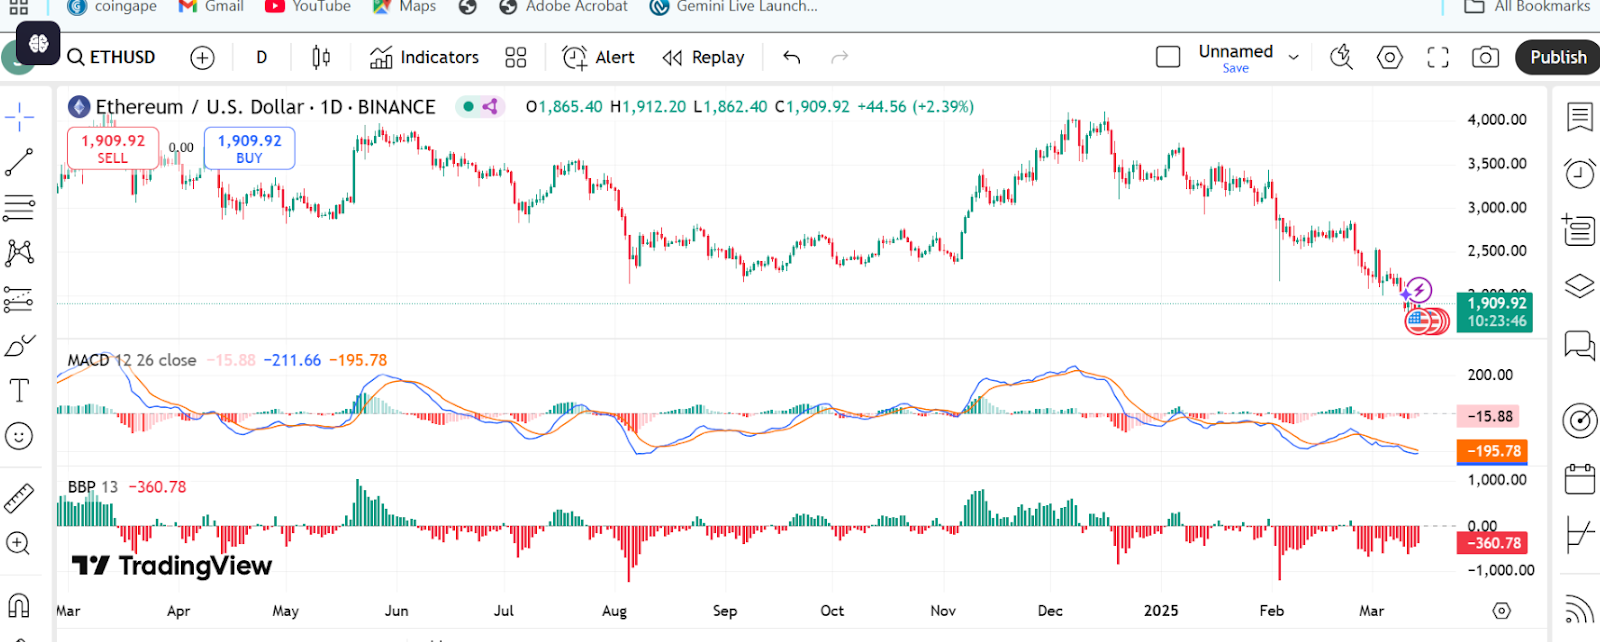
Ethereum Price Chart Source: TradingView
Similarly, the BBP indicator which determines the balance between bullish and bearish forces currently shows negative values.
The current market trend shows bearish dominance because the BBP registered -360.78.
If ETH breaks through vital support zones its selling pressure will intensify to potentially drive it even lower.
Price Drops in the Charts
Ethereum price has undergone a substantial drop in recent weeks showing a 14% decrease during the past week and a 25% decline during the last month.
Market uncertainty combined with heightened volatility caused these remarkable price drops.
Ethereum faces mounting investor anxiety since it fails to protect its position above important support levels.
Throughout the past month, Ethereum showed continuous bearish trends that showed no indication of an upward trend.
Ethereum’s price reduction matches the wider market conditions that have impacted several cryptocurrencies through macroeconomic variables.
A continued price decline might push Ethereum toward reaching its $1,250 target that analysts have predicted.
Meanwhile, recent analysis shows Ethereum (ETH) in a declining parallel channel pattern and forecasting a drop to $1,250 values in case the current trend sustains.
Ethereum price faces critical support tests including the Realized Price level of $2,060 and analysts expect potentially severe drops from $200 to $400 during widespread bear market conditions.
Read the full article here


